hl_qual Monitor Textual UI
On this Page
hl_qual Monitor Textual UI
The monitor is a textual UI that enables the monitoring of Intel® Gaudi® AI accelerators run parameters such as temperature, power usage, clock, ECC errors and more. The monitor also shows the test progress via a progress bar as well as the expected test time completion.
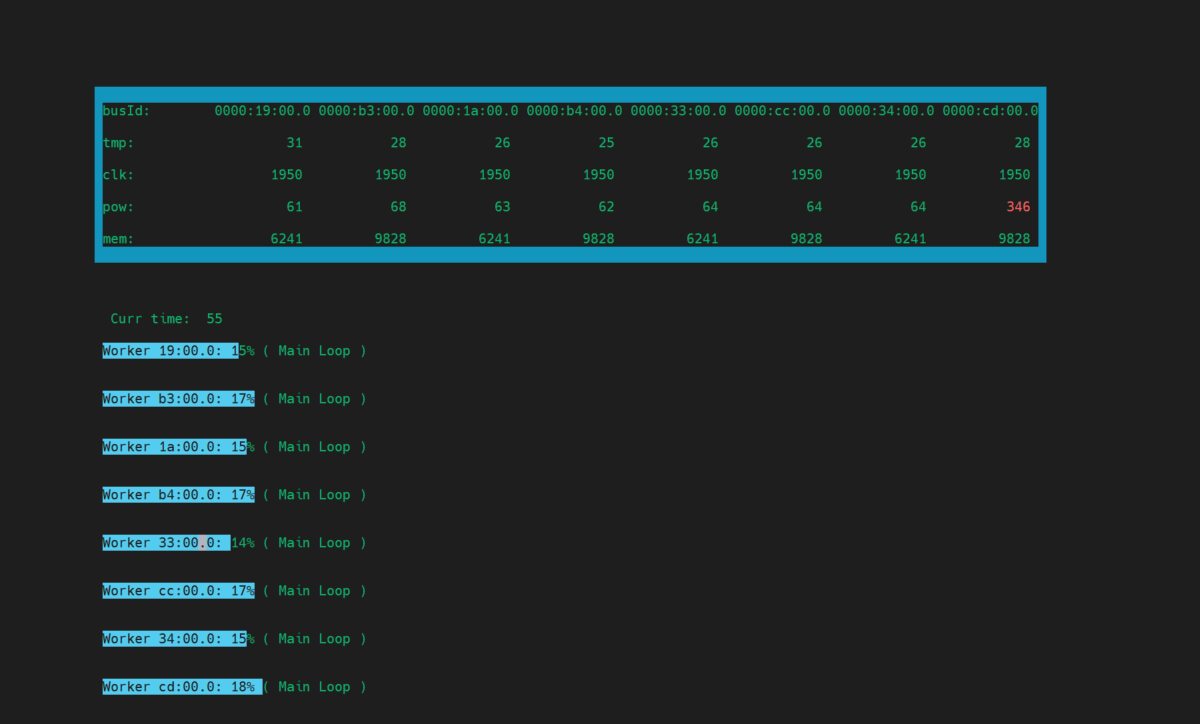
Figure 19 Monitor Textual UI Interface
You can disable the monitor screen printout using the -dis_mon switch. This option is important when you run the hl_qual
in a scripting environment.
Note
Disabling the monitor does not stop parameter collection as these are needed for the hl_qual’s final test report. You may configure which parameters should be collected by configuring a monitor INI configuration file. For more information about monitor configuration file, refer to Monitor ini Configuration File.
Monitor ini Configuration File
The following sections are fixed in ini configuration file:
[TEMP_MON]- Temperature monitoring parameter section.[POWER_MON]- Power usage monitoring parameter section.[CLOCK_MON]- Clock monitoring parameter section.[MEM_MON]- Memory usage monitoring parameter section.[SRAM_SERR_MON]- Single error on SRAM memory monitoring parameter section.[SRAM_DERR_MON]- Double error on SRAM memory monitoring parameter section.[DRAM_SERR_MON]- Single error on DRAM (HBM) memory monitoring parameter section.[DRAM_SERR_MON]- Double error on DRAM (HBM) memory monitoring parameter section.
The following ini snippets show the applicable control fields:
[TEMP_MON]
enable=true
LOW=15
HIGH=75
[POWER_MON]
enable=true
LOW=45
HIGH=340
[CLOCK_MON]
enable=true
LOW=1850
HIGH=1950
[MEM_MON]
enable=false
HIGH=30720
[SRAM_SERR_MON]
enable=true
[SRAM_DERR_MON]
enable=true
[DRAM_SERR_MON]
enable=true
[DRAM_DERR_MON]
enable=true
enable- Enables or disables monitoring a specific value. Applicable values: true/false.LOW- States the specific low value for the monitored parameter. If the measured value is below that threshold, the monitor marks it in red on the monitoring UI.HIGH- States the specific high value for the monitored parameter. If the measured value is above that threshold, the monitor marks it in red on the monitoring UI.
Note
Disabling the monitoring on specific values makes the sampling process work faster, and improve the monitor UI refresh rate, especially when the system contains multiple devices.
hl_qual Samples Logger
The monitoring module that performs sampling also logs all sample data points to a file, located in $HABANA_LOGS/qual. The monitor will log the following values:
AIP Temperature values
Clock values
Power draw values
To log the above values, you must verify that these are enabled in the monitor.ini file as detailed in the Monitor ini Configuration File section.
The sample file generated by the monitor will have the following format:
clock_log_<device-busID>.txt
power_log_<device-busID>.txt
temp_log_<device-busID>.txt
The monitor logger enables the logging of 8,640,000 samples per sample type which covers 12 hours of test runs. When the logging process fills the logger buffer it will stop logging new information.
Note
To ensure better sampling rate, you can disable/enable only the needed samples (clock, temperature or power). The following average sample timing can be used:
Temperature sampling time - 70 ms
Clock sampling time - 5 ms
Power sampling time - 5 ms
Sampling all three values can take 80ms per three samples, about 12.5 triplets sample per second. Sampling only power and clock will produce about 100 pair samples per second.