Analysis
On this Page
Analysis
After generating a file with the .hltv suffix, you can proceed to load it onto the habana-perfetto application.
Supported OS:
Ubuntu 24.04 |
Note
It is highly recommended to run this app from a local or remote-desktop session (such as VNC/RDP) for improved stability and performance. Remote X11 forwarding sessions (e.g. MobaXterm, ssh -X) can cause significant rendering delays.
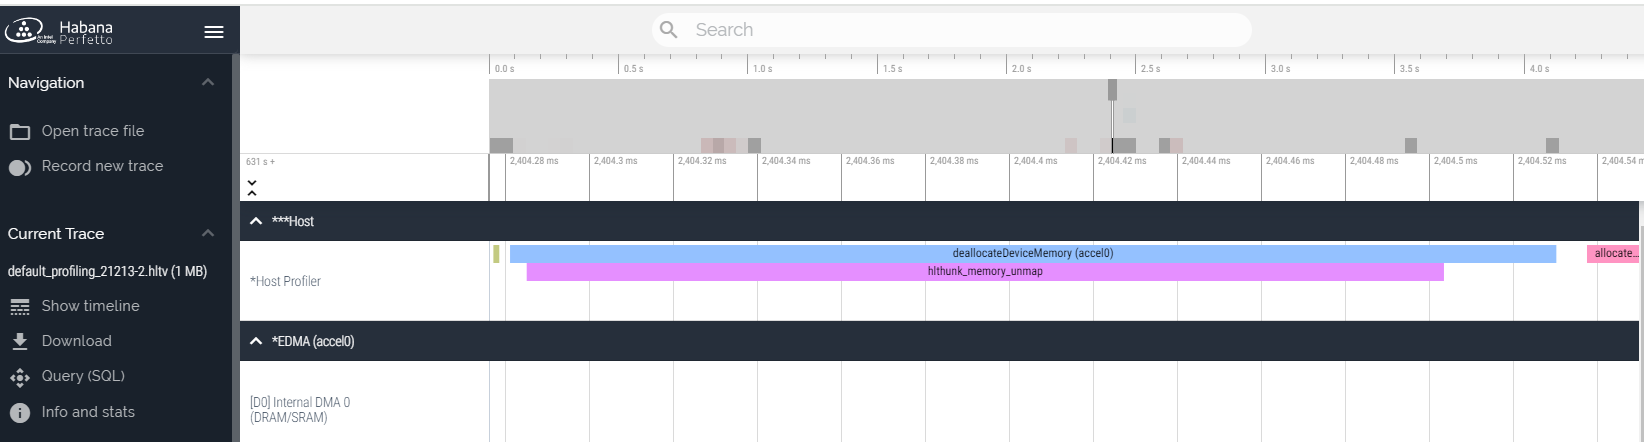
Under the Host section, you can view the captured host API calls and the various Gaudi engines.
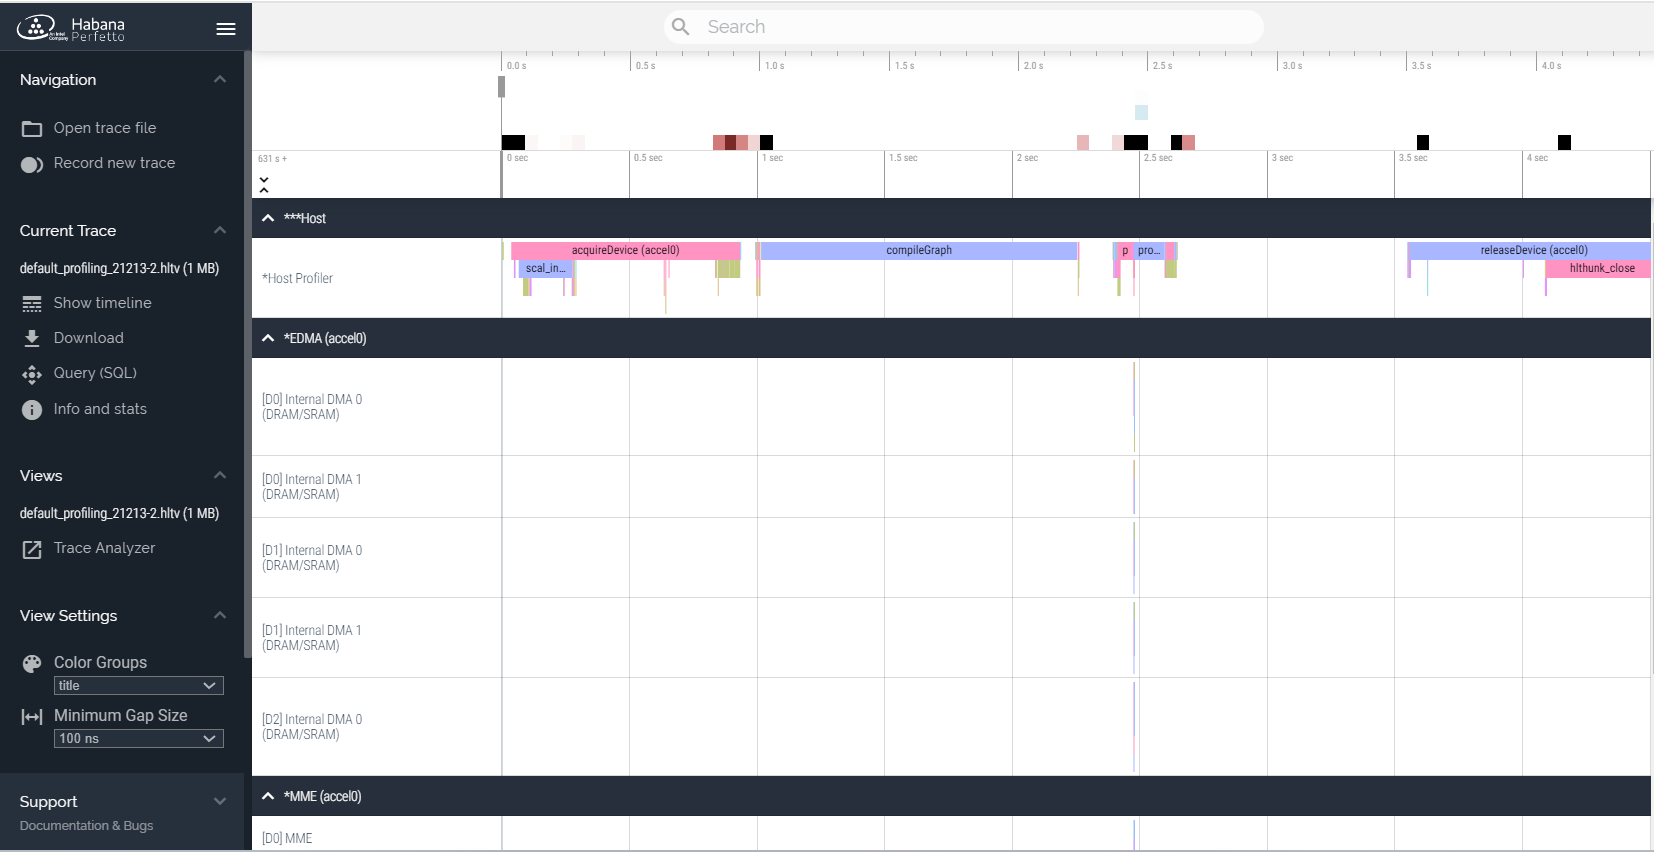
You can now navigate the trace by zooming in or panning over it using ‘w’/’a’/’s’/’d’ or CTRL + mouse scroll.
To search for a particular event, follow the steps below:
Enter the name of a specific node in the search box located at the top of the screen.
Press Enter.
Press ‘m’ to set a marker, and ‘f’ to focus.
This will take you to the appropriate part of the timeline, where you can view the relevant event.
Trace Analyzer
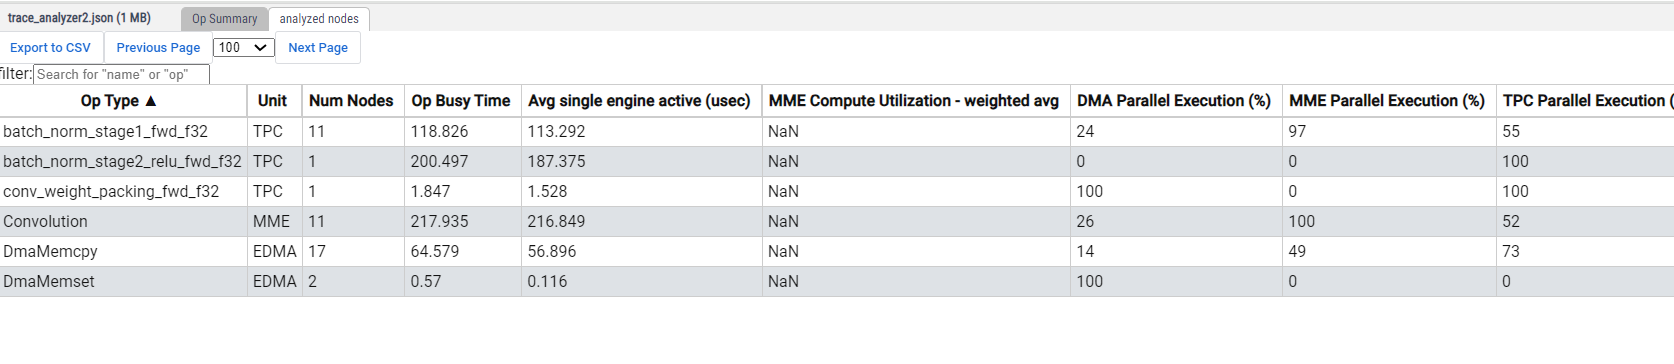
The trace analyzer is a built-in feature in Perfetto that aims to reduce the time spent on analyzing large traces and facilitate the identification of optimization options. In the sidebar panel, clicking on the ‘Trace Analyzer’ link enables you to access aggregate data for each operation, such as the overall duration, MME utilization, and other relevant information. If you double-click on a specific row, the “Analyzed Nodes” tab will be displayed, filtered for the selected operation.
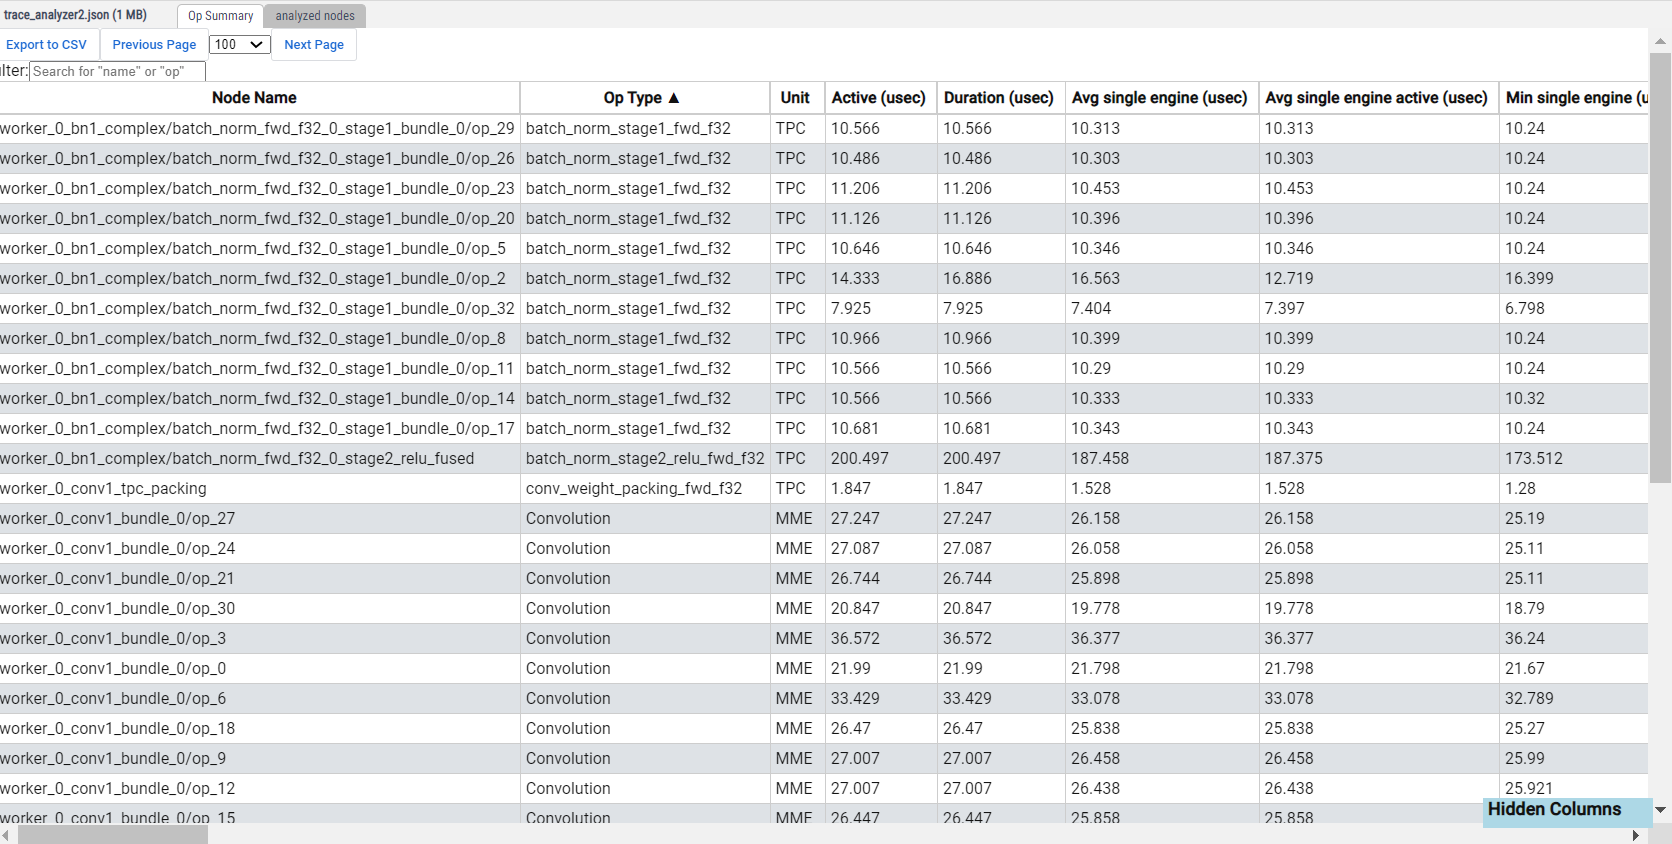
The “Analyzed Nodes” tab provides more details about each node in the executed graph. To filter the rows based on node name or operation, you can use the filter option located at the top left corner of the tab. You can also sort the rows by clicking on a specific column header, drag and drop to change the order of the columns, and hide a column by moving it to the “Hidden Columns” box.
The sort selection and column order are saved in cookies for your next HLTV session.