BMC Exporter User Guide
On this Page
BMC Exporter User Guide
BMC exporter exposes metrics to Prometheus and ensures data is organized, secure, and exported efficiently while scaling out to numerous machines. Prometheus is an open-source application used alongside Grafana, a dashboard visualization tool. Grafana utilizes AlertManager, which manages alerts and notifies users of potential issues.
The BMC exporter uses Redfish protocol to transmit commands during each data scrape. With Redfish, users can interact with systems through standard web services, like HTTP and REST APIs.
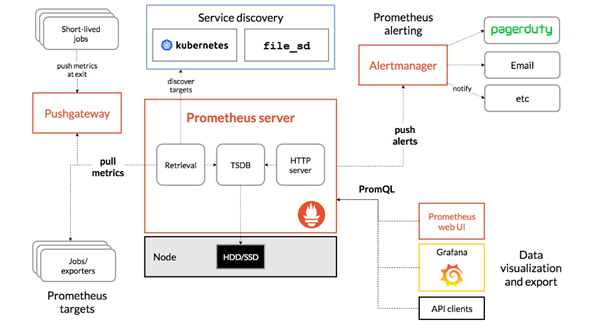
Figure 23 Prometheus Components
Note
The BMC exporter is supported on Gaudi 3 and Gaudi 2.
Highlights:
The BMC exporter is specifically tested and designed for use with Intel Gaudi drivers. Attempting to run it with other drivers, such as a developer driver, may result in missing functionality.
Ulimit: The BMC exporter requires one file descriptor per BMC for the UDP socket, so it may be necessary to increase the limit. To check the current number of file descriptors a process can open, run
ulimit -ncommand. You can maximize the number of file descriptors used by the BMC exporter by runningulimit -Sn $(ulimit -Hn).Upon receiving SIGINT or SIGTERM signals, the BMC exporter gracefully shuts down its web server, waits for all ongoing scrapes to complete, and then closes all BMC connections.
Alerts: In addition to alerting on BMC metrics, you may also want to receive notifications if the BMC exporter becomes unhealthy. Both the BMC exporter and its underlying BMC library were developed with Prometheus in mind, providing a wide range of metrics including collection latency and the number of attempted IPMI commands for each IP address.
The BMC exporter can either run with Deployment or DaemonSet. Deployment enables a single instance monitoring of all the servers configured in the config file. It can be used when deploying in Docker or in Kubernetes. With DaemonSet, the application has multiple instances where each Kubernetes node monitors its own BMC. It can be used in Kubernetes deployment.
Prerequisites
To use the BMC exporter for Prometheus, the management node (local system) must have one of the following containerized solutions installed:
Docker
Podman
Kubernetes
Configuring BMC Exporter
To use the BMC exporter, generate a JSON configuration file containing the server access details. Two available types of files are described below:
Basic Configuration - If the hosts share the same username and password, you can add a single set of credentials in this configuration file. This set will be considered as the default, allowing the BMC exporter to access all hosts using these credentials. For example:
{
    "username": "ADMIN",
    "password": "ADMIN"
}
Advanced Configuration - If the credentials of each host are different, you can specify them alongside their respective host IP addresses in the configuration file. The default port for the BMC exporter is 4001, although it can be modified if necessary. For example:
{
    "username": "ADMIN",
    "password": "ADMIN",
    "port": "5000",
    "servers": [
        {
            "password": "ADMIN",
            "username": "ADMIN",

            // Bmc name/ip address
            "hostname": "192.168.22.188"

            // Required when running in a K8S daemonset,
            // this is the name of the kubernetes node which the bmc is in charge of
            "srv": <KUBERNETES_NODE_NAME>
        },
        {
            "password": "ADMIN",
            "username": "ADMIN",

            // Bmc name/ip address
            "hostname": "192.168.22.189"

            // Required when running in a K8S daemonset,
            // this is the name of the kubernetes node which the bmc is in charge of
            "srv": <KUBERNETES_NODE_NAME>
        }
    ]
}
Deploying BMC Exporter in Docker
To deploy the BMC exporter in Docker, run the below:
docker run -p 5003:5000 -v `pwd`:/tmp docker.io/intel/gaudi-bmc-exporter:1.24.1-482 -config /tmp/config.json -daemon-set false --exporter='g3-red-fish'
To deploy the BMC exporter in Docker, run the below:
docker run -p 5003:5000 -v `pwd`:/tmp docker.io/intel/gaudi-bmc-exporter:1.24.1-482 -config /tmp/config.json -daemon-set false
Deploying BMC Exporter in Kubernetes
To deploy the BMC exporter in Kubernetes, apply the files described below.
Note
Make sure to have Kubernetes Prometheus stack installed before you start. Refer to helm-charts.
Choose whether to deploy the application as DaemonSet or as Deployment:
Deployment
apiVersion: apps/v1
kind: Deployment
metadata:
  name: bmc-monitoring
  namespace: monitoring
  labels:
    app: bmc-monitoring
spec:
  selector:
    matchLabels:
      app: bmc-monitoring
  template:
    metadata:
      labels:
        app: bmc-monitoring
    spec:
      containers:
      - name: bmc-monitoring
        image: docker.io/intel/gaudi-bmc-exporter:1.24.1-482
        imagePullPolicy: Always
        args:
          - "--config"
          - "/tmp/config.json"
          - "--daemon-set"
          - "false"
          - "--exporter='g3-red-fish'"
        resources:
          limits:
            memory: 3Gi
            cpu: 500m
          requests:
            cpu: 350m
            memory: 2Gi
        # readiness probes mark the service available to accept traffic.
        readinessProbe:
          httpGet:
            path: /debug/readiness
            port: 5000
          initialDelaySeconds: 50
          periodSeconds: 15
          timeoutSeconds: 5
          successThreshold: 1
          failureThreshold: 2
        # liveness probes mark the service alive or dead (to be restarted).
        livenessProbe:
          httpGet:
            path: /debug/liveness
            port: 5000
          initialDelaySeconds: 50
          periodSeconds: 30
          timeoutSeconds: 5
          successThreshold: 1
          failureThreshold: 2
        volumeMounts:
        - name: config-volume
          mountPath: /tmp
        env:
          - name: USERNAME
            valueFrom:
              secretKeyRef:
                name: bmc-monitoring-secret
                key: username
          - name: PASSWORD
            valueFrom:
              secretKeyRef:
                name: bmc-monitoring-secret
                key: password
      volumes:
      - name: config-volume
        configMap:
          name: bmc-exporter-conf
DaemonSet
apiVersion: apps/v1
kind: DaemonSet
metadata:
  name: bmc-monitoring
  namespace: monitoring
  labels:
    app: bmc-monitoring
spec:
  updateStrategy:
    rollingUpdate:
      maxUnavailable: 25%
  selector:
    matchLabels:
      app: bmc-monitoring
  template:
    metadata:
      labels:
        app: bmc-monitoring
    spec:
      serviceAccountName: bmc-exporter-service-account
      affinity:
        nodeAffinity:
          requiredDuringSchedulingIgnoredDuringExecution:
            nodeSelectorTerms:
            - matchExpressions:
              - key: node-role.kubernetes.io/control-plane
                operator: DoesNotExist
      containers:
      - name: bmc-monitoring
        image: docker.io/intel/gaudi-bmc-exporter:1.24.1-482
        imagePullPolicy: Always
        args:
          - "--config"
          - "/tmp/config.json"
          - "--exporter='g3-red-fish'"
        resources:
          limits:
            memory: 250Mi
            cpu: 250m
          requests:
            cpu: 150m
            memory: 100Mi
        # readiness probes mark the service available to accept traffic.
        readinessProbe:
          httpGet:
            path: /debug/readiness
            port: 5000
          initialDelaySeconds: 5
          periodSeconds: 15
          timeoutSeconds: 5
          successThreshold: 1
          failureThreshold: 2
        # liveness probes mark the service alive or dead (to be restarted).
        livenessProbe:
          httpGet:
            path: /debug/liveness
            port: 5000
          initialDelaySeconds: 5
          periodSeconds: 30
          timeoutSeconds: 5
          successThreshold: 1
          failureThreshold: 2
        volumeMounts:
        - name: config-volume
          mountPath: /tmp
        env:
          - name: KUBERNETES_NODENAME
            valueFrom:
              fieldRef:
                fieldPath: spec.nodeName
          - name: USERNAME
            valueFrom:
              secretKeyRef:
                name: bmc-monitoring-secret
                key: username
          - name: PASSWORD
            valueFrom:
              secretKeyRef:
                name: bmc-monitoring-secret
                key: password
      volumes:
      - name: config-volume
        configMap:
          name: bmc-exporter-conf
Apply the rest of the files. To apply all the files simultaneously, run
kubectl apply -f <file1> -f <file2>:Secret
apiVersion: v1
kind: Secret
metadata:
  name: bmc-monitoring-secret
  namespace: monitoring
type: Opaque
data:
  username: <BASE64 USERNAME>
  password: <BASE64 PASSWORD>
Config Map
apiVersion: v1
kind: ConfigMap
metadata:
  name: bmc-exporter-conf
  namespace: monitoring
data:
  config.json: |
    {
    "username": "",
    "password": "",
    "port": "5000",
    "servers": [
    {
      "hostname": ""
    }
    ]
    }
Service
apiVersion: v1
kind: Service
metadata:
  name: bmc-monitoring-service
  namespace: monitoring
  labels:
    app: bmc-monitoring
spec:
  selector:
    app: bmc-monitoring
  ports:
    - protocol: TCP
      port: 5000
      targetPort: 5000
      name: bmc-monitoring-endpoint
Service Monitor
apiVersion: monitoring.coreos.com/v1
kind: ServiceMonitor
metadata:
  labels:
    release: stable
    app: bmc-monitoring
  name: bmc-monitoring-service-monitor
  namespace: monitoring
spec:
  endpoints:
  - interval: 5m
    path: /metric
    port: bmc-monitoring-endpoint
    scrapeTimeout: 1m30s
  namespaceSelector:
    matchNames:
    - monitoring
  selector:
    matchLabels:
      app: bmc-monitoring
To deploy the BMC exporter in Kubernetes, apply the files described below.
Note
Make sure to have Kubernetes Prometheus stack installed before you start. Refer to helm-charts.
Choose whether to deploy the application as DaemonSet or as Deployment:
Deployment
apiVersion: apps/v1
kind: Deployment
metadata:
  name: bmc-monitoring
  namespace: monitoring
  labels:
    app: bmc-monitoring
spec:
  selector:
    matchLabels:
      app: bmc-monitoring
  template:
    metadata:
      labels:
        app: bmc-monitoring
    spec:
      containers:
      - name: bmc-monitoring
        image: docker.io/intel/gaudi-bmc-exporter:1.24.1-482
        imagePullPolicy: Always
        args:
          - "--config"
          - "/tmp/config.json"
          - "--daemon-set"
          - "false"
        resources:
          limits:
            memory: 3Gi
            cpu: 500m
          requests:
            cpu: 350m
            memory: 2Gi
        # readiness probes mark the service available to accept traffic.
        readinessProbe:
          httpGet:
            path: /debug/readiness
            port: 5000
          initialDelaySeconds: 50
          periodSeconds: 15
          timeoutSeconds: 5
          successThreshold: 1
          failureThreshold: 2
        # liveness probes mark the service alive or dead (to be restarted).
        livenessProbe:
          httpGet:
            path: /debug/liveness
            port: 5000
          initialDelaySeconds: 50
          periodSeconds: 30
          timeoutSeconds: 5
          successThreshold: 1
          failureThreshold: 2
        volumeMounts:
        - name: config-volume
          mountPath: /tmp
        env:
          - name: USERNAME
            valueFrom:
              secretKeyRef:
                name: bmc-monitoring-secret
                key: username
          - name: PASSWORD
            valueFrom:
              secretKeyRef:
                name: bmc-monitoring-secret
                key: password
      volumes:
      - name: config-volume
        configMap:
          name: bmc-exporter-conf
DaemonSet
apiVersion: apps/v1
kind: DaemonSet
metadata:
  name: bmc-monitoring
  namespace: monitoring
  labels:
    app: bmc-monitoring
spec:
  updateStrategy:
    rollingUpdate:
      maxUnavailable: 25%
  selector:
    matchLabels:
      app: bmc-monitoring
  template:
    metadata:
      labels:
        app: bmc-monitoring
    spec:
      serviceAccountName: bmc-exporter-service-account
      affinity:
        nodeAffinity:
          requiredDuringSchedulingIgnoredDuringExecution:
            nodeSelectorTerms:
            - matchExpressions:
              - key: node-role.kubernetes.io/control-plane
                operator: DoesNotExist
      containers:
      - name: bmc-monitoring
        image: docker.io/intel/gaudi-bmc-exporter:1.24.1-482
        imagePullPolicy: Always
        args:
          - "--config"
          - "/tmp/config.json"
        resources:
          limits:
            memory: 250Mi
            cpu: 250m
          requests:
            cpu: 150m
            memory: 100Mi
        # readiness probes mark the service available to accept traffic.
        readinessProbe:
          httpGet:
            path: /debug/readiness
            port: 5000
          initialDelaySeconds: 5
          periodSeconds: 15
          timeoutSeconds: 5
          successThreshold: 1
          failureThreshold: 2
        # liveness probes mark the service alive or dead (to be restarted).
        livenessProbe:
          httpGet:
            path: /debug/liveness
            port: 5000
          initialDelaySeconds: 5
          periodSeconds: 30
          timeoutSeconds: 5
          successThreshold: 1
          failureThreshold: 2
        volumeMounts:
        - name: config-volume
          mountPath: /tmp
        env:
          - name: KUBERNETES_NODENAME
            valueFrom:
              fieldRef:
                fieldPath: spec.nodeName
          - name: USERNAME
            valueFrom:
              secretKeyRef:
                name: bmc-monitoring-secret
                key: username
          - name: PASSWORD
            valueFrom:
              secretKeyRef:
                name: bmc-monitoring-secret
                key: password
      volumes:
      - name: config-volume
        configMap:
          name: bmc-exporter-conf
Apply the rest of the files. To apply all the files simultaneously, run
kubectl apply -f <file1> -f <file2>:Secret
apiVersion: v1
kind: Secret
metadata:
  name: bmc-monitoring-secret
  namespace: monitoring
type: Opaque
data:
  username: <BASE64 USERNAME>
  password: <BASE64 PASSWORD>
Config Map
apiVersion: v1
kind: ConfigMap
metadata:
  name: bmc-exporter-conf
  namespace: monitoring
data:
  config.json: |
    {
    "username": "",
    "password": "",
    "port": "5000",
    "servers": [
    {
      "hostname": ""
    }
    ]
    }
Service
apiVersion: v1
kind: Service
metadata:
  name: bmc-monitoring-service
  namespace: monitoring
  labels:
    app: bmc-monitoring
spec:
  selector:
    app: bmc-monitoring
  ports:
    - protocol: TCP
      port: 5000
      targetPort: 5000
      name: bmc-monitoring-endpoint
Service Monitor
apiVersion: monitoring.coreos.com/v1
kind: ServiceMonitor
metadata:
  labels:
    release: stable
    app: bmc-monitoring
  name: bmc-monitoring-service-monitor
  namespace: monitoring
spec:
  endpoints:
  - interval: 5m
    path: /metric
    port: bmc-monitoring-endpoint
    scrapeTimeout: 1m30s
  namespaceSelector:
    matchNames:
    - monitoring
  selector:
    matchLabels:
      app: bmc-monitoring
TLS Support
To enable TLS, pass the below flags to the BMC exporter runtime:
-tls_cert- specifies path to the TLS certificate file.-tls_key- specifies path to the TLS key file.
Exposed Data
The following outlines the monitoring components exposed to Prometheus.
Note
Since the BMC exporter support with Gaudi 3 is still maturing, only the /metrics endpoint is available. This will be addressed in future releases.
Monitoring Component |
Description |
Endpoint |
|---|---|---|
All metrics |
Exposes all metrics. |
/metrics |
All metrics via probing |
Exposes all metrics of a specific server. |
/probe?target=<SERVER_NAME> |
OAM Info |
Internal modules IDs and main memories sizes. |
/info |
OAM Status |
Device operational status. |
/status |
Temperature |
Current, max and historical temperatures and thresholds. |
/temperature |
Power |
Peak and current power consumption. |
/power |
Frequency |
Max and current frequencies. |
/frequency |
Ethernet Info |
Ethernet configuration info and complete connectivity status. |
/ethernet-info |
Ethernet Status |
Ethernet status per port. |
/ethernet-status, /ethernet-status-counters |
PCIe Info |
PCIe information and errors. |
/pcie-info |
Alerts |
Error alerts and information. |
/alerts |
Sensors Temperature |
Temperature sensors readouts. |
/sensor-temperature |
Ctemperature |
Current maximal temperature between SOC and HBMs temperatures. |
/ctemperature |
Sensors Voltage |
Voltage sensors readouts. |
/sensor-voltage |
Sensors Voltage Monitor |
Voltage monitors readouts. |
/sensor-voltage-monitor |
Sensors Current |
Current sensors readouts. |
/sensor-current |
Security |
Security related information. |
/security |
HBM |
HBM information related to repairs and repair resources. |
/hbm |
BMC state |
BMC state (up/down). |
/bmc-state |
Exporter info |
Application information, such as version. |
/exporter-info |
Direct |
Direct NVMe-MI information. |
/direct |
Configuration Using Prometheus
Prometheus fundamentally stores all data as a time series: streams of timestamped values of the same metric and the same sets of labeled dimensions. The BMC data exported from the BMC exporter can be accessed in Prometheus for easier management. For details, refer to Prometheus documentation. For example:
    - job_name: bmc
scrape_interval: 30s                  # a 30s scrape interval is recommended
metrics_path: /metrics                      # the exporter exposes its own metrics at /metrics
static_configs:
- targets:
    - 192.168.22.189                     # strings corresponding to the keys in secrets.yml
    - 192.168.22.188
relabel_configs:
- source_labels: [__address__]
    target_label: __param_target
- source_labels: [__param_target]
    target_label: instance
- target_label: __address__
    replacement: localhost:5000         # the location of the exporter to Prometheus
Adding Grafana Dashboard and Alerts
Follow the below steps to add Grafana dashboard and alerts.
Note
Adding Grafana via API is only available for Grafana versions 9.0 and 9.5.
Preparation
Create a dashboard folder:
Sign in to Grafana.
Click “Dashboards” on the left-side menu.
On the Dashboards page, click “New” and select “New folder” in the dropdown menu.
Enter a unique name and click “Create”. For further details, refer to Manage dashboards | Grafana documentation.
Get a folder UID:
Select the folder you want.
Click on “Go to folder”.
Save the folder UID. For example, in
https://habana-grafana.com/dashboards/f/toPjxZy4z/bmc-exporter,toPjxZy4zis the folder UID.
Create an API Key. For further instructions, refer to API keys.
Importing habana_alert
Before importing
habana_alert, make sure to set up the following:<GRAFANA URL> - https://grafana-k8s.habana-labs.com/api/v1/provisioning/alert-rules
<API KEY>
Import
habana_alertusing the API:wget https://vault.habana.ai/ui/repos/tree/General/habana-bmc-exporter/grafana-configs.tgz tar -xf grafana-configs.tgz # Modify the folderUID in JSON alert by running the jq command. jq '.folderUID = "<FOLDER ID>"' './grafana/alerts/Habana Oam Alerts.json' > ./habana_oam_alerts.json # Modify the datasource UID to your datasource uid sed -i s/'"datasourceUid": "prometheus"/"datasourceUid": "<DATASOURCE_UID">/' ./habana_oam_alerts.json curl --data "@habana_oam_alerts.json" -H "Authorization: Bearer <API KEY>" -H "Content-Type: application/json" <GRAFANA URL>/api/v1/provisioning/alert-rules # Modify the folderUID in JSON alert by running the jq command. jq '.folderUID = "<FOLDER ID>"' './grafana/alerts/Port toggling.json' > ./port_toggle_alerts.json # Modify the datasource UID to your datasource uid sed -i s/'"datasourceUid": "prometheus"/"datasourceUid": "<DATASOURCE_UID">/' ./port_toggle_alerts.json curl --data "@port_toggle_alerts.json" -H "Authorization: Bearer <API KEY>" -H "Content-Type: application/json" <GRAFANA URL>/api/v1/provisioning/alert-rules
Importing habana_dashboard
Import habana_dashboard using the API:
wget https://vault.habana.ai/ui/repos/tree/General/habana-bmc-exporter/grafana-configs.tgz
tar -xf grafana-configs.tgz
for file in $(ls grafana/dashboards/*)
do
  # Update the dashboard with your DataSource uid.
  sed -e 's/"uid": "prometheus"/"uid": "<DATASOURCE_UID>"/' > habana_dashboard.json
  curl -X POST -H "Authorization: Bearer <API KEY>"  -H "Content-Type: application/json" -d @habana_dashboard.json <GRAFANA URL>/api/dashboards/db
done
To import habana_dashboard using GUI, refer to Manage dashboards | Grafana documentation.