Starting a Debug Session
On this Page
Starting a Debug Session
Starting a debug session requires running the TPC test program and starting a debug session from Visual Studio Code that will attach to the TPC test program. You can either start the TPC test program manually and request Visual Studio Code to attach to it, or you can request Visual Studio Code to start the test program before attaching to it.
Starting a Visual Studio Code debug session requires adding a new launch configuration in the launch.json file located under your working folder.
The launch configuration for the TPC debug extension will be different depending on whether it needs to attach to a running TPC test program or
if the TPC test program should be started by the debug session.
To add the default launch configuration, refer to Add default launch configuration. By default, the steps outlined in this section is suitable for attaching to a running TPC test program. After adding the default launch configuration, refer to one of the specific setup sections to configure it according to your preferred method of operation:
Add Default Launch Configuration
Open the “Run and Debug” tab in Visual Studio Code by either clicking on the “Play+Bug” icon on the left side bar or by using the “Ctrl+Shift+D” keyboard shortcut.
If no folder opens, you will see a blue “Run and Debug” button and with a link named “Open a folder and create launch.json” below it. In this case, click on the “Open a folder” link and choose an existing folder to open or create a new folder. After the folder is opened, hit “Ctrl+Shift+D” again to re-open the “Run and Debug” tab.
If a new folder is created, click the “create launch.json file” link and choose the “Select Environment” option menu, then select “Habanalabs TPC Debugger” to create a
launch.jsonfile. This will create alaunch.jsonfile and will add the default launch configuration as described in step 5. (Skip step 4)If a
launch.jsonfile already exists in the folder, press the “Option” menu located on the right side of the green “Play” button and choose “Add Configuration…”: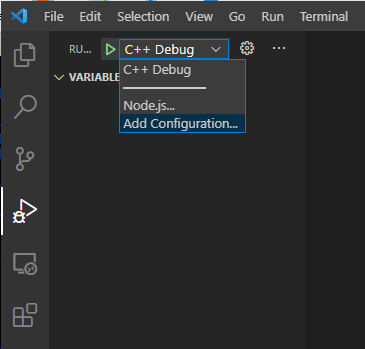
In the pop-up window, choose “Habanalabs TPC Debug: Launch”. This will add the default launch configuration.
You should see the following entry added to the
launch.jsonfile{ "type": "tpc_debugger", "name": "TPC Attach", "request": "launch", "remote_host": "${command:AskForHostName}", "remote_port": "${command:AskForPortNum}" },
Manually Run the TPC Test Program
Open a command shell on the target machine, set the environment variable TPC_VSCODE_DEBUG=1 and run the TPC test program.
After the test program starts running, at the first TPC invocation the program will stop and wait for the Visual Studio Code debug session to attach to it
as in the following example:
$ TPC_VSCODE_DEBUG=1 ~/builds/tpc_kernels_release_build/tests/tpc_kernel_tests ~/builds/tpc_kernels_debug_build/tests/tpc_kernel_tests --gtest_filter=sanity/GaudiReduceProdF32Test5D.*

Note: Google Test filter = sanity/GaudiReduceProdF32Test5D.*
[==========] Running 20 tests from 1 test case.
[----------] Global test environment set-up.
[----------] 20 tests from sanity/GaudiReduceProdF32Test5D
[ RUN      ] sanity/GaudiReduceProdF32Test5D.gaudi_reduce_prod_fwd_f32/ifm_DxWxHxBxA_64x6x2x2x1_dim0_perm_offset_0
Habana Labs TPC simulator Library - version 0.15.0.22a699f3
Dap server Waiting on port 4710
As shown in the above example, the debugger back-end will wait for connection on TCP port 4710 (default port).
A different port number can be used by setting the TPC_VSCODE_DEBUG environment variable to the desired port number instead to 1.
While the program waits for the debugger to attach to it, in Visual Studio Code “Run and Debug” panel, select the default “TPC Attach” launch configuration that was previously added (see: Add default launch configuration) and hit F5 to start a debug session.
When using the default launch configuration, an input box will appear. Specify the host name and then the port number of the target machine on which the TPC test program is running in that input box. After it connects, the debug session will start and the TPC kernel will be stopped on the first instruction.
To save the host name and port number, modify the launch configuration in one of two ways:
For remote host debugging, specify the host name and port number in the “remote_host” and “remote_port” arguments of the configuration:
{
    "type": "tpc_debugger",
    "name": "TPC Attach",
    "request": "launch",
    "remote_host": "my_target_hostname"
    "remote_port": "4710"
},
For local host debugging on the default port, comment out or completely remove the “remote_host” and “remote_port” arguments:
{
    "type": "tpc_debugger",
    "name": "TPC Attach",
    "request": "launch",
    //"remote_host": "${command:AskForHostName}",
    //"remote_port": "${command:AskForPortNum}"
},
Automatically Launch TPC Test Program on a Local Machine
You can change the launch configuration to run the TPC test program automatically when a new debug session is initialized. For this, the command line of the TPC test program should be specified in the launch configuration.
Change the default launch configuration that was added previously (See: Add default launch configuration) and add “program” and (optionally) “args” attributes to specify the command and command arguments of the TPC test program.
You can also change the configuration name from “TPC Attach”. See the following example:
{
    "type": "tpc_debugger",
    "name": "TPC Test Run",
    "request": "launch",
    "program": "${env:HOME}/builds/tpc_kernels_release_build/tests/tpc_kernel_tests",
    "args": [
        "--gtest_filter=sanity/GaudiReduceProdF32Test5D.*"
    ]
}
When selecting the above “TPC Test Run” configuration in the “Debug and Run” panel and pressing the green “Play” button, or F5, a new terminal will be added to the “Terminal” view at the bottom of Visual Studio Code window and the TPC test program will be launched in this terminal. Once the program invokes the first TPC kernel invocation, vscode will attach to it and the debug session will start. The TPC kernel execution will be stopped on the first kernel instruction.
Automatically Launch TPC Test Program on Remote Machine
In order to set up a Visual Studio Code debug session to run and debug a TPC test program on a remote machine, the “Remote - SSH” extension of Visual Studio Code should be used. This extension allows Visual Studio Code to connect to a remote machine through ssh connection for remote Run and Debug sessions.
If “Remote - SSH” extension is not yet installed, press “Ctrl+Shift+X” in Visual Studio code to go the the extensions view. Type “Remote SSH” in the search text box and select the extension to install.
Press “F1” to open the command palette and type “Remote-SSH: Connect to host…” and Enter.
You will be asked to add a new remote host configuration and specify the host name and username to use for the SSH connection. Once added, connect to the host (a password may be requied). Once the remote host is connected, a new Visual Studio Code window will appear. In this window, all operations (e.g., “Open Folder”) are done on the remote host. Only the GUI part is visible locally.
Press “Ctrl+Shift+X” in the new Visual Studio Code window to open the extensions view. In this view, you will see two lists of extensions, the local installed extensions and remote host extensions. You need to make sure that “Habanalabs TPC Debugger” extension is installed on the remote machine. If it is installed locally but not on the remote host, you will see a button inside the local extension bullet that allows you to copy and install it on the remote machine.
Follow the same steps described in Automatically Launch TPC Test Program on a Local Machine. In this window, you work as if Visual Studio Code is running on the remote machine.