Getting Started with Intel Gaudi Profiler
Getting Started with Intel Gaudi Profiler
This guide provides simple steps to easily profile Intel® Gaudi® software applications without making any changes to the code:
Modify the configuration file in the Intel Gaudi Profiling subsystem:
$ hl-prof-config -e off -phase=multi-enq -g 1-20 -s my_profiling_session
Note
The
hl-prof-configcommand is configured to capture the model execution from the first graph launch until the 20th graph launch. If it appears that some significant part of the model is missing, you can modify thehl-prof-config flagto-g 1-20.Set the below environment variable to enable the Intel Gaudi Profiling subsystem:
$ export HABANA_PROFILE=1
Execute any Intel Gaudi software-based application (such as PyTorch or the Intel Gaudi software API). Once done, you should be able to locate a file with
my_profiling_sessionprefix and.hltvsuffix in your working directory.Download and open the habana-perfetto application:
$ sudo apt install <.deb file>
$ habana-perfetto
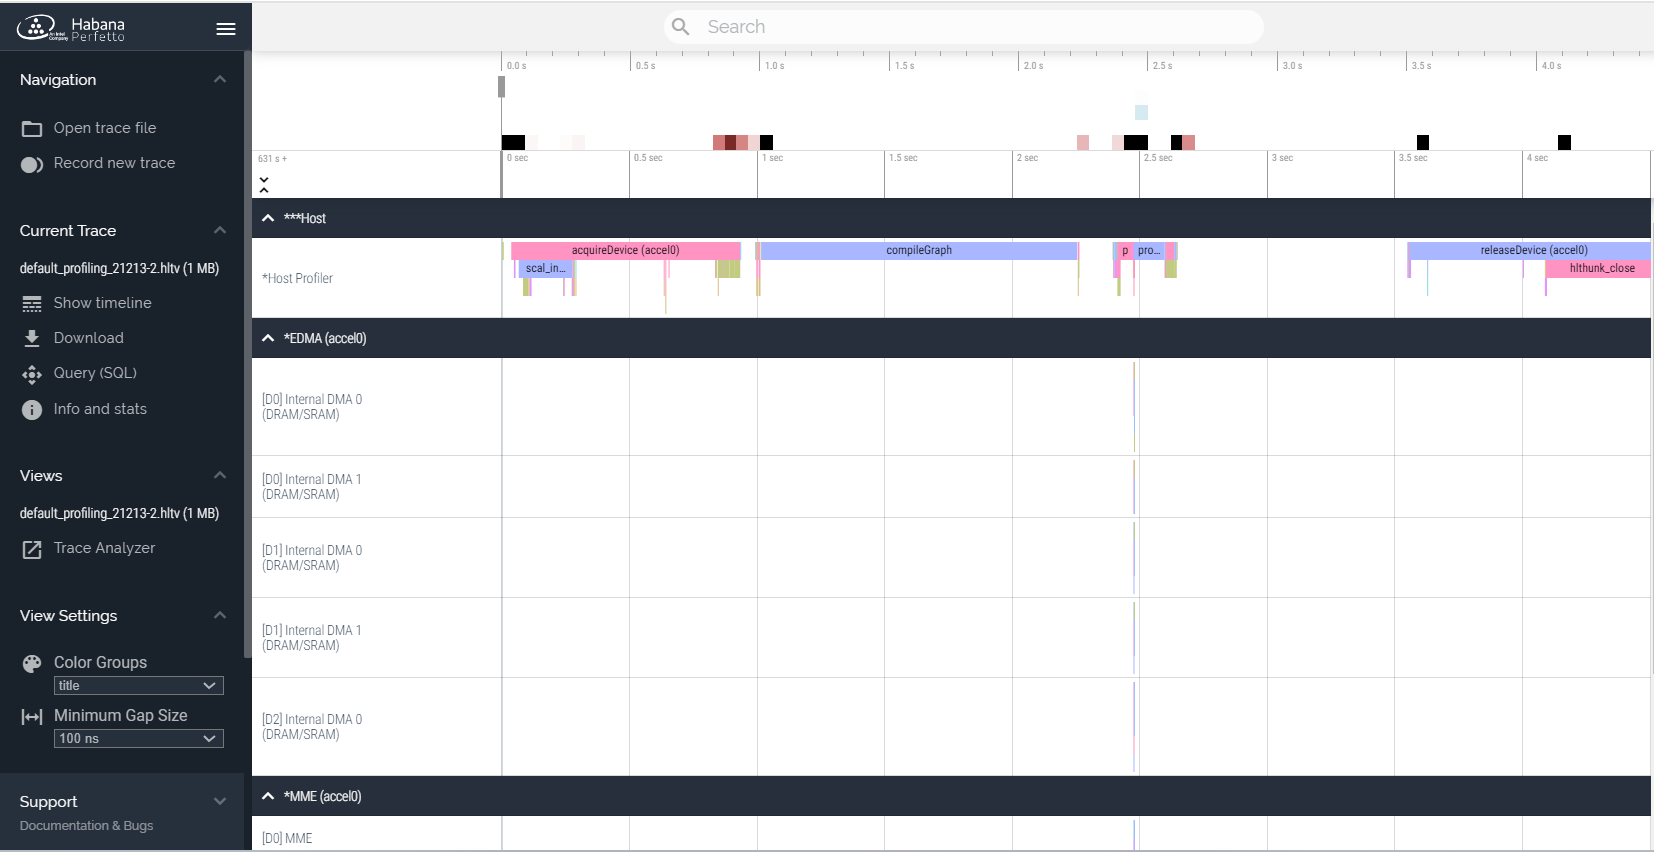
- Upload the file to the habana-perfetto application and view the API calls and hardware trace events.
the habana-perfetto application opens each trace in a new tab.