Profiling with PyTorch
On this Page
Profiling with PyTorch
This section provides simple guidelines to profile your model during the training process. Additionally, it provides guidelines on how to use TensorBoard to view Intel® Gaudi® AI accelerator specific
information for performance profiling. These capabilities are enabled using the torch-tb-profiler TensorBoard plugin which is included in the Intel Gaudi PyTorch package. To install the package, see Installation Guide and On-Premise System Update.
The below table lists the performance enhancements that the plugin analyzes and provides guidance for:
Component |
Description |
|---|---|
Performance |
|
Dataloader optimization |
|
Setting up TensorBoard
Enable TensorBoard logging in your model as shown in the example below. For demo purposes and to examine the trace file, you may run this code as a standalone Python script by pasting it in a Python file (e.g. profiling.py) and running
python profiling.py:1import torch 2import habana_frameworks.torch.core as htcore 3 4activities = [torch.profiler.ProfilerActivity.CPU] 5 6#CUDA: 7#device = torch.device('cuda:0') 8#activities.append(torch.profiler.ProfilerActivity.CUDA) 9 10#HPU: 11device = torch.device('hpu') 12activities.append(torch.profiler.ProfilerActivity.HPU) 13 14with torch.profiler.profile( 15 schedule=torch.profiler.schedule(wait=0, warmup=20, active=5, repeat=1), 16 activities=activities, 17 on_trace_ready=torch.profiler.tensorboard_trace_handler('./profile_logs')) as profiler: 18 for i in range(100): 19 input = torch.tensor([[i]*10]*10, dtype=torch.float32, device=device) 20 result = torch.matmul(input, input) 21 result.to('cpu') 22 htcore.mark_step() 23 profiler.step()
Note
In the example above, the data is collected from steps 21 to 25 and trace files are saved in the
profile_logsfolder. Make sure to consider the limited capacity of your buffer, which is responsible for collecting data within the Profiling subsystem.Start the TensorBoard server in a dedicated terminal window. In the example below, the listening port is set to 5990 and the log directory is pointed to the ./profile_logs folder:
$ tensorboard --logdir ./profile_logs --bind_all --port=5990
Open a new window tab in your browser and check out your TensorBoard website using http://fq_domain_name:5990 or http://localhost:5990.
You are now prepared to begin your training.
Viewing TensorBoard
The following types of information are produced by TensorBoard:
Model performance tracking - While your workload is being processed in batches, you can track the progress of the training process on the dashboard in real-time by monitoring the model’s cost (loss) and accuracy.
Profiling analysis - Right after the last requested step is completed, the collected profiling data is analyzed by TensorBoard and then immediately submitted to your browser, without any need to wait until the training process is completed.
Note
Carefully consider the size of your buffer and the number of steps you actually need to profile.
If you require an extension for your buffer, refer to Profiling with Intel Gaudi Software section.
In most use cases, the default settings are sufficient, and there is no need for any internal parameter adjustments.
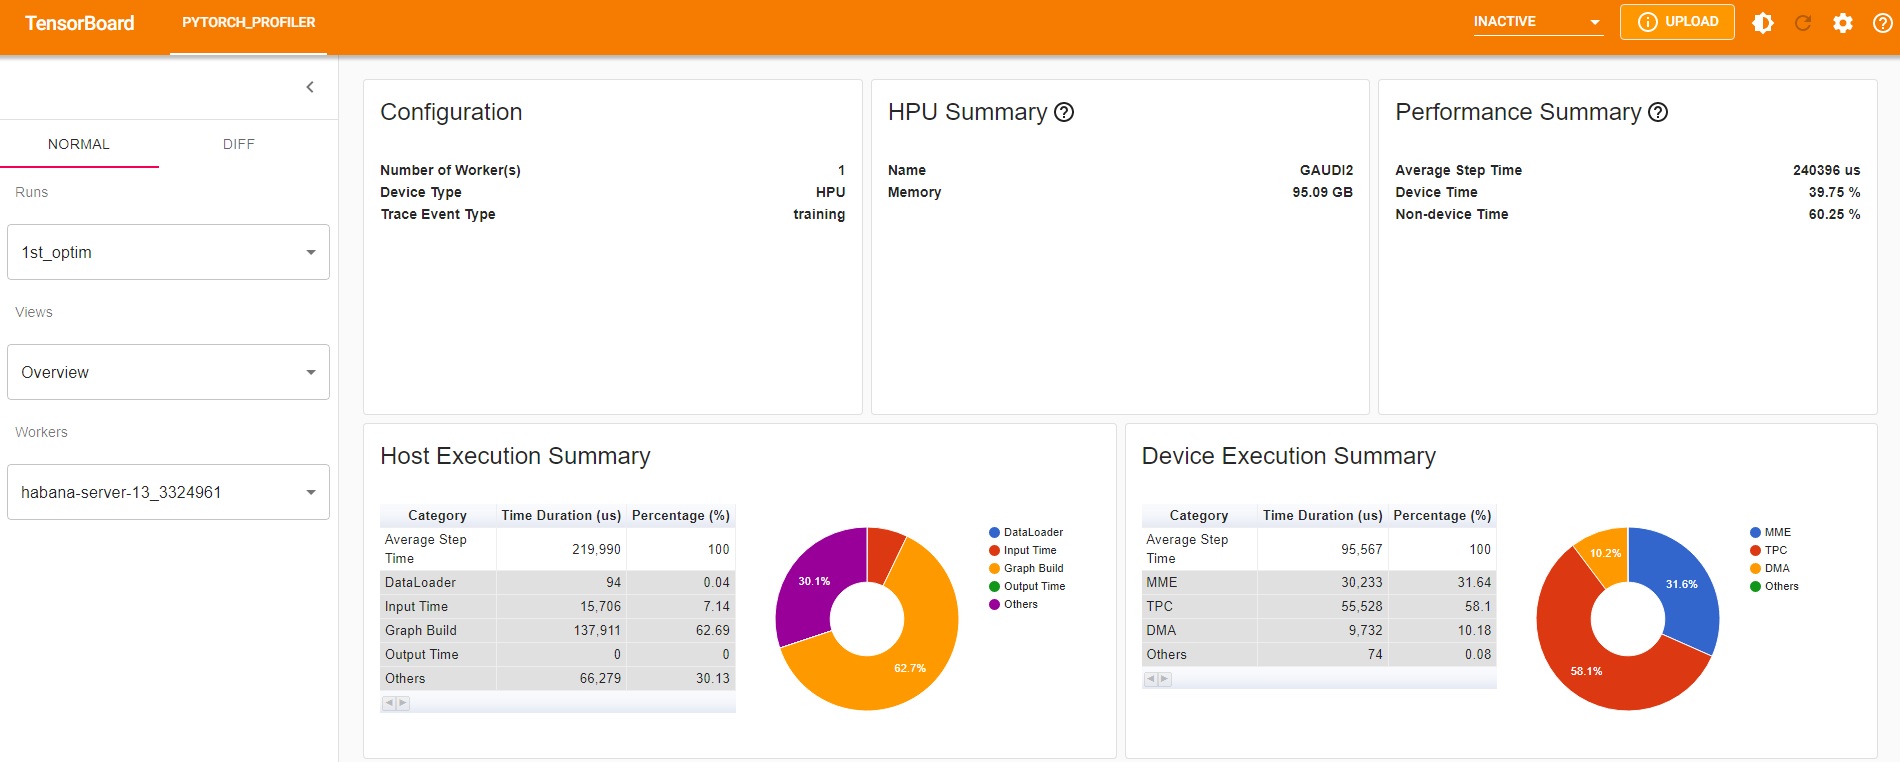
HPU Overview
The initial TensorBoard profiling view includes a comprehensive summary of Gaudi, showing both the Gaudi device execution information as well as the Host CPU information. You will be able to see the utilization of both host and device as well as debug guidance at the bottom of the section that can provide some guidance for performance optimization.
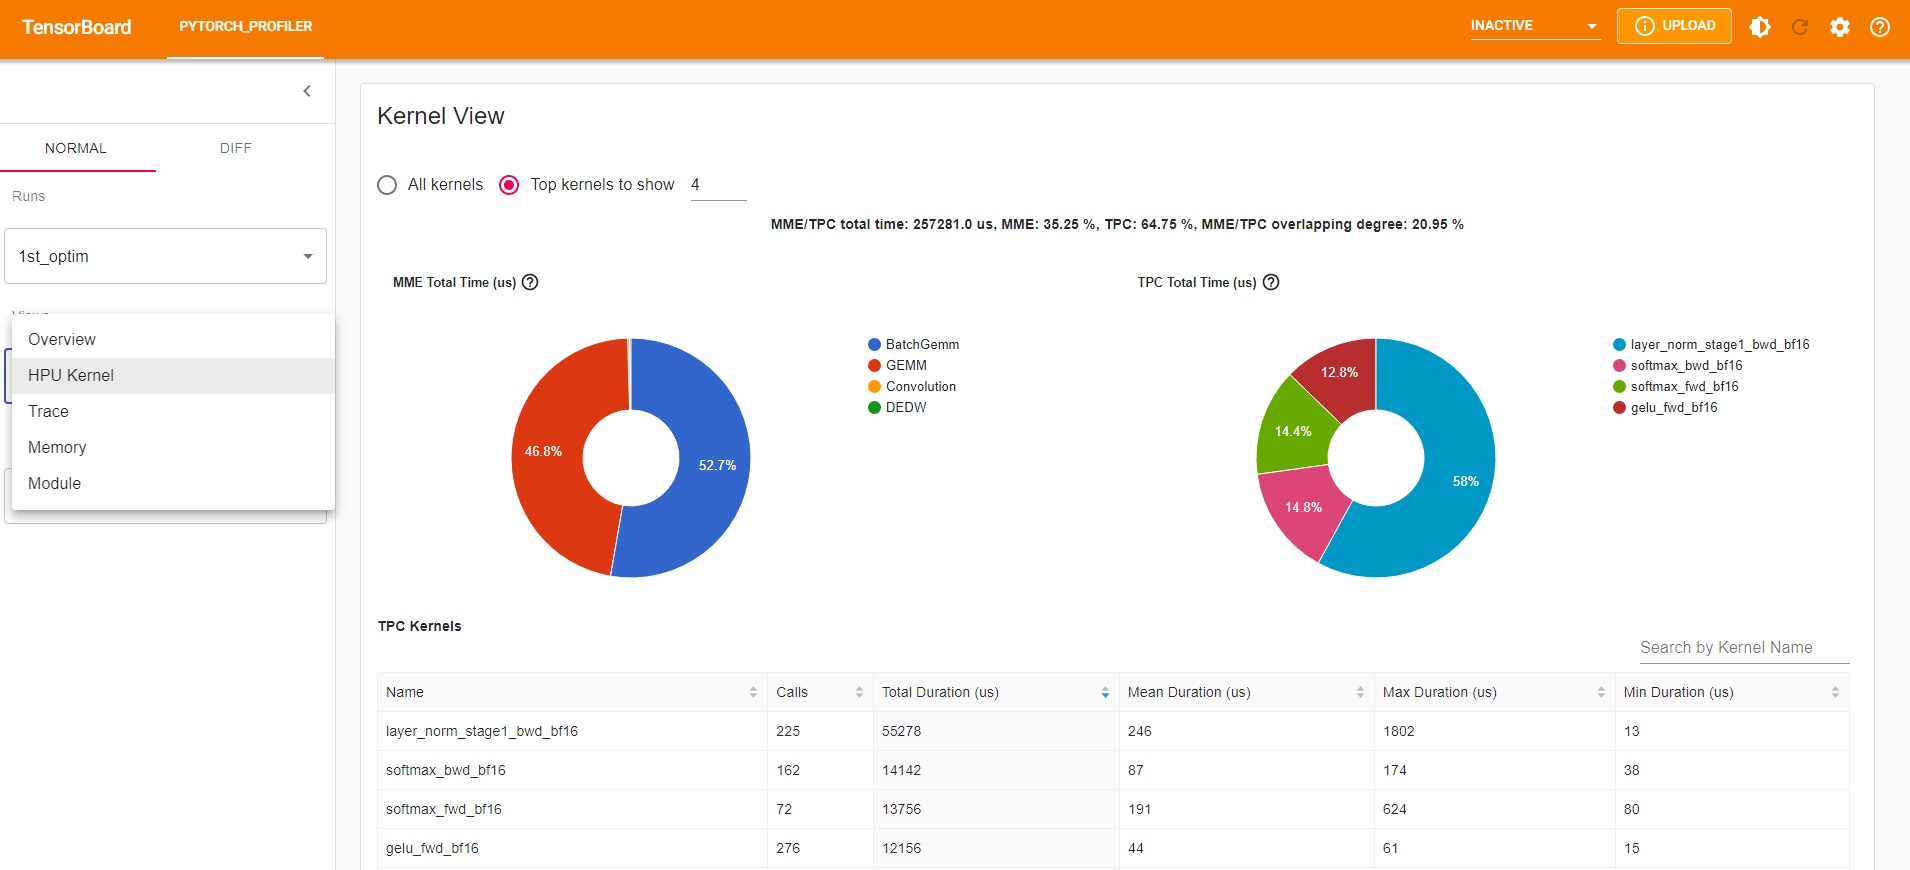
HPU Kernel View
The HPU kernel view provides specific details, showing HPU kernel utilization in the Tensor Processing Cores (TPC) and the matrix multiplication engine (MME).
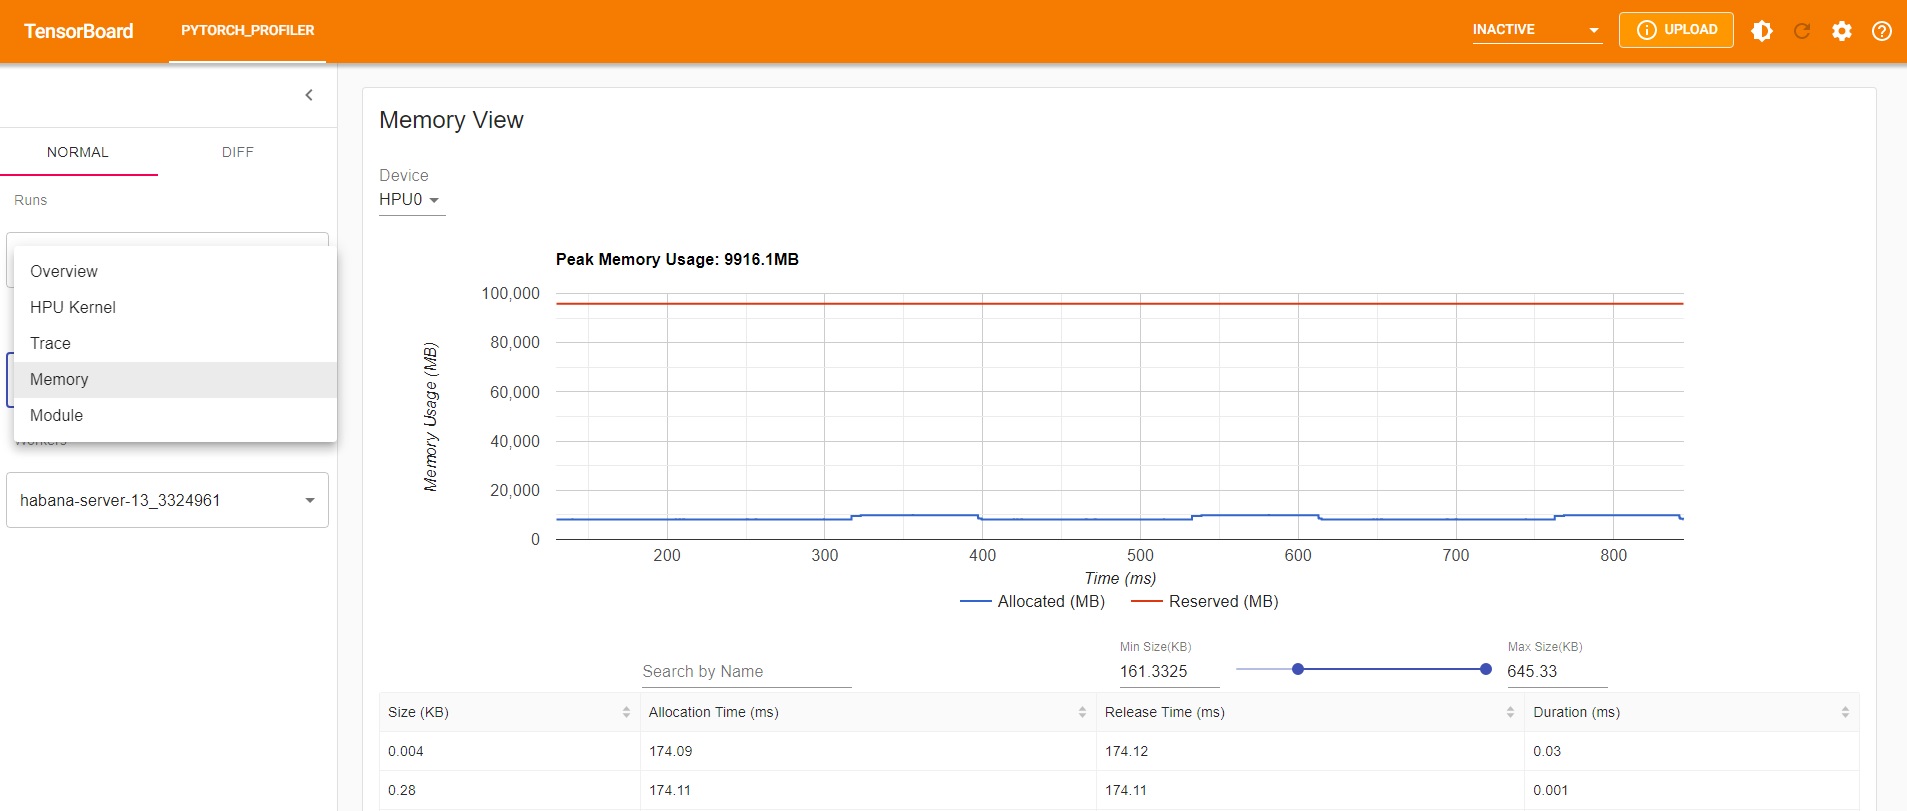
Memory Profiling
To monitor HPU memory during training, set the profile_memory argument to True in the torch.profiler.profile function.
The below shows a usage example:
with torch.profiler.profile(
    schedule=torch.profiler.schedule(wait=0, warmup=20, active=5, repeat=1),
    activities=activities,
    on_trace_ready=torch.profiler.tensorboard_trace_handler('./profile_logs'),
    profile_memory=True) as profiler:
As a result, an additional view named “Memory View” will appear in TensorBoard.
Perf Tool
If you do not want to run the TensorBoard UI, you can take the same JSON log files and use the habana_perf_tool. The tool parses the existing JSON
file and provides the same recommendations for performance enhancements. For more details, see Perf Tool and TensorBoard Model Scanning.