Profiling Real-World Examples
On this Page
Profiling Real-World Examples
The below provides some case studies on how profiling helps in identifying problems and further optimizations of various models.
StableDiffusion XL Finetune Example
In this example, a pytorch profile(.json) of a StableDiffusion XL finetune process is examined in the habana-perfetto application.
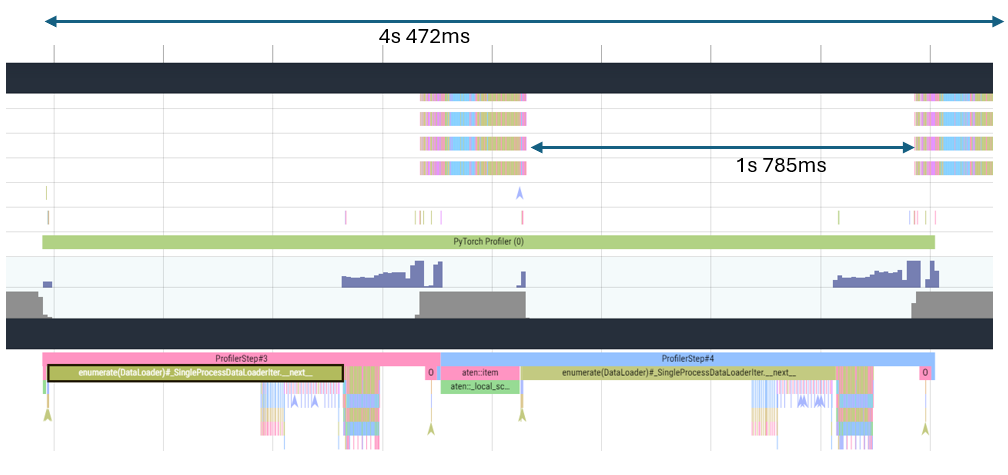
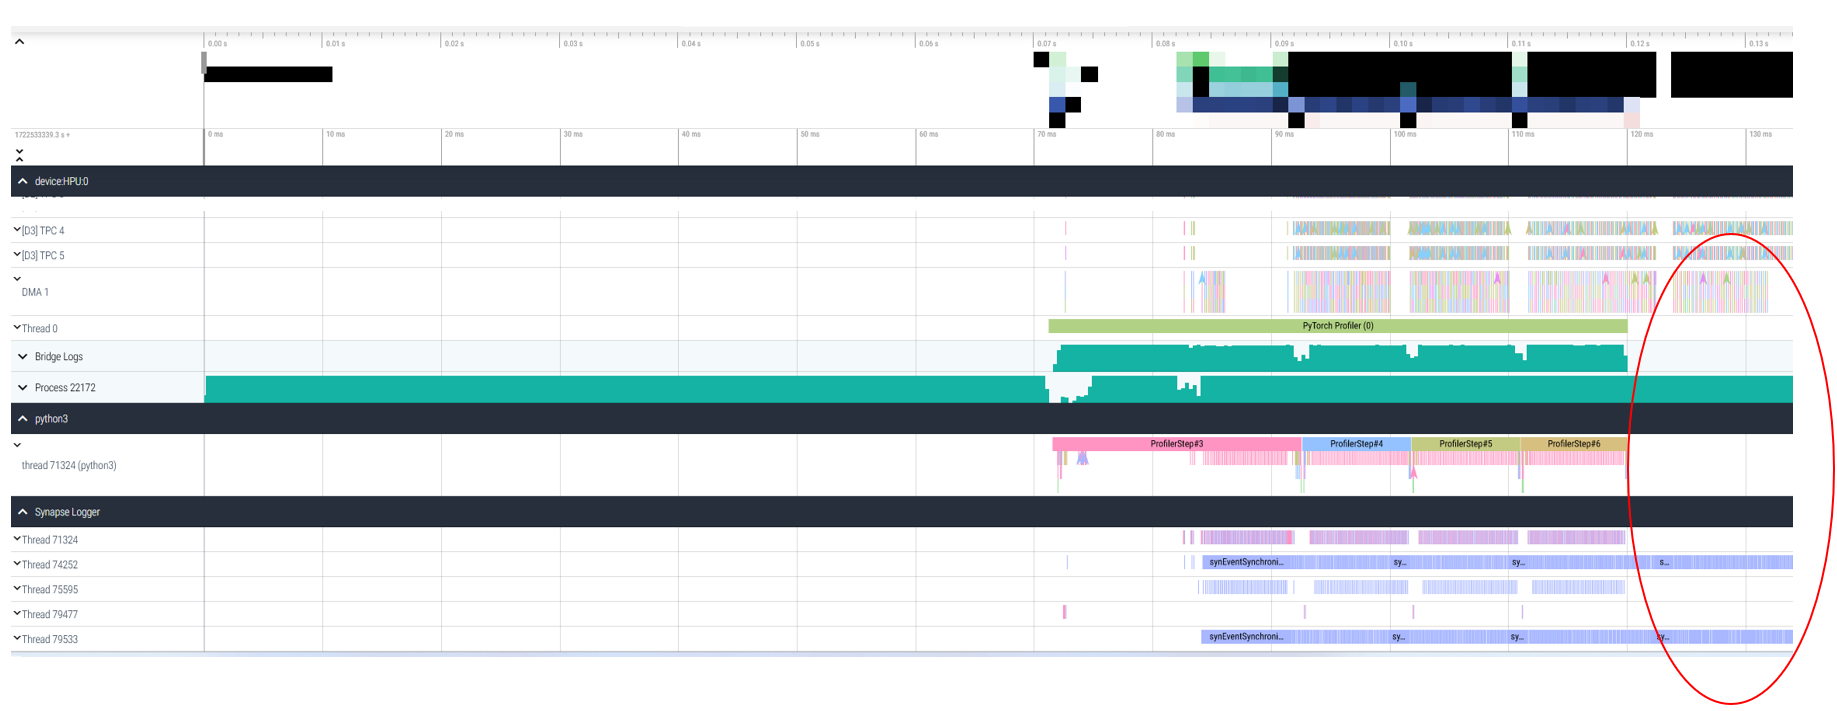
The trace image below shows large periods of time with no device utilization (upper portion of the image) in between successive profiling steps, resulting in inefficient device usage. On the host side (bottom section of the image), the dataloader iterator function call on the host appears to take up most of the total execution time for each profiling step. This initial analysis suggests that the process is host-bound which can also be observed by running the Habana Perf Tool:
The identified issue in the dataloader can be mitigated using increment --dataloader-num-processes parameter in the run command until results improve as seen below:
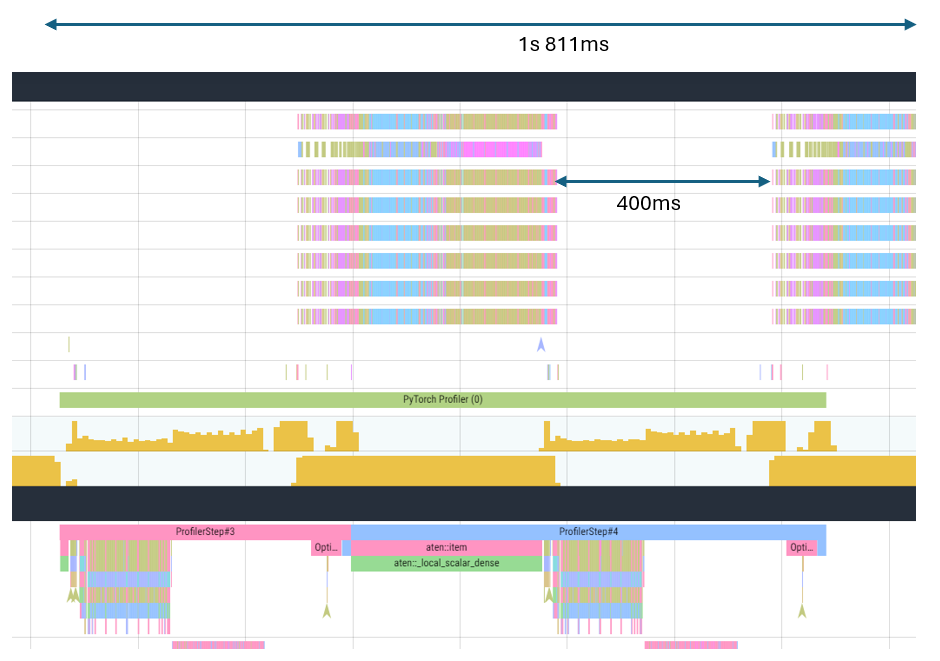
Large periods of no device utilization is still observed between the two profiling steps.
The aten::item function call is taking up major execution time. This call occurs on the host when obtaining tensor values (e.g. loss prints) from the device.
This can be reduced by increasing the --logging_steps parameter. After this enhancement, device utilization improves (has more continuity and no large gaps):
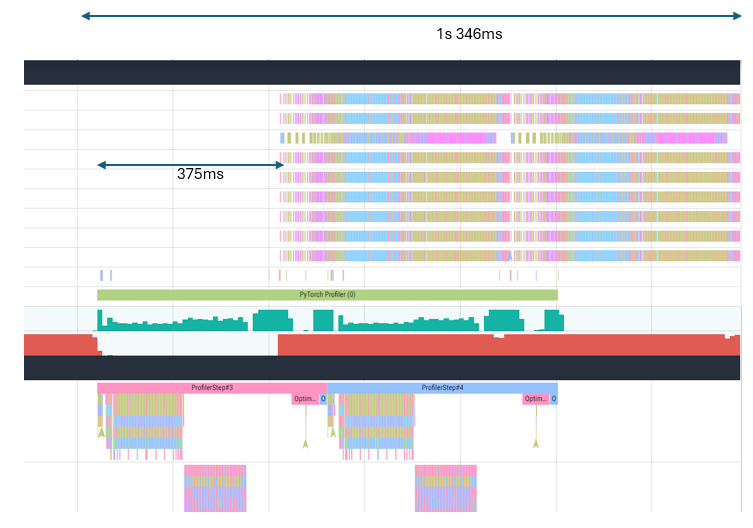
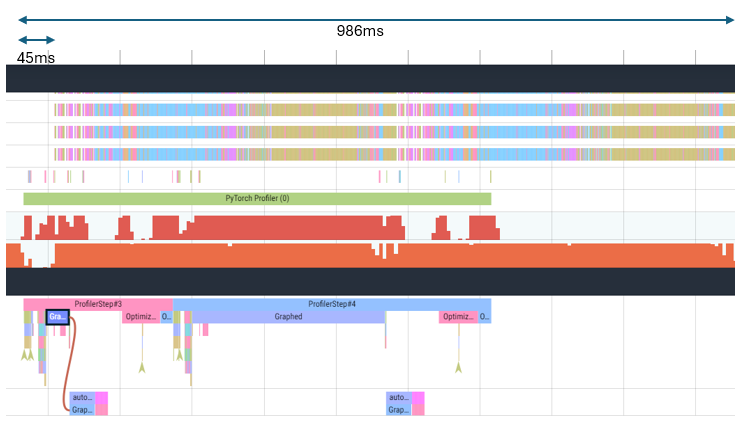
There is still a delay between host process and device execution at the beginning. This can be alleviated by using HPU graphs as seen below:
Optimum for Intel Gaudi Example
This example uses a text-generation command based on Deepspeed and Optimum for Intel Gaudi:
deepspeed --num_gpus 8 run_generation.py --model_name_or_path meta-llama/Llama-2-7b-hf --max_new_tokens 256 --bf16 --use_hpu_graphs --use_kv_cache --batch_size 180 --attn_softmax_bf16 --limit_hpu_graphs --reuse_cache --trim_logits
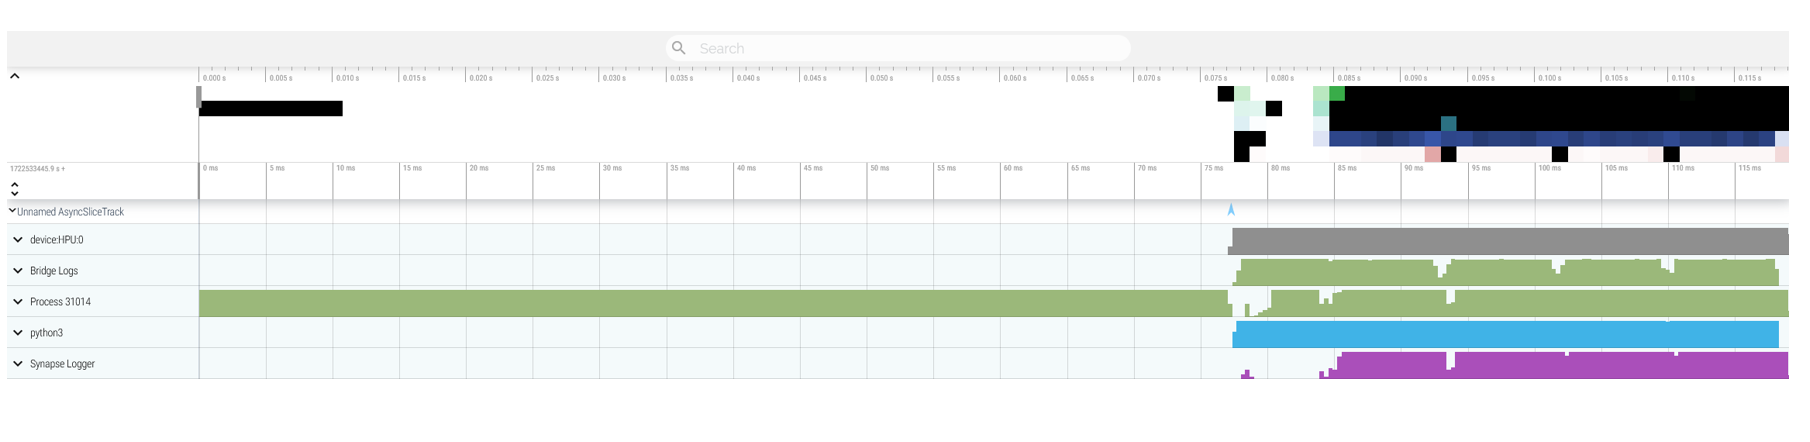
The below is how the low-level trace(.hltv) for this process looks when loaded in the habana-perfetto application. A big gap on the right end of the trace is observed. The Python process has finished but device DMA, TPC and Synapse logger threads are still busy. Ideally, these processes should be tightly synced and not cause such big lags (in tens of milliseconds):
There appears to be some overhead in data transfer during data pre-processing phase which may be due to inefficient memory access and resource contention on the host.
This problem is remedied by using --bind_cores_to_rank parameter which instructs DeepSpeed to split the CPU cores and distribute them to each rank evenly for better memory management and improved data parallelism:
Hugging Face GPT Example
In this Hugging Face GPT based model’s text generation example, the first token generation is taking far too long (nearly 30 minutes). The latency is being caused due to waiting for some process on device and thus analysis is focused on the device side.
In the trace below, observe the compileGraph function call repeating contiguously at each profile step.
This is unexpected as normally the graph is compiled once, cached and reused in the next step.

This is an indication of dynamicity in the model which could be due to dynamic shapes, dynamic ops and/or loops in the control flow of the graph itself. Follow the Handling Dynamicity guide to mitigate these issues.