Debug Session Views and Operations
On this Page
Debug Session Views and Operations
The following figure shows the main view area in the Visual Studio Code window when a TPC debug session is started.
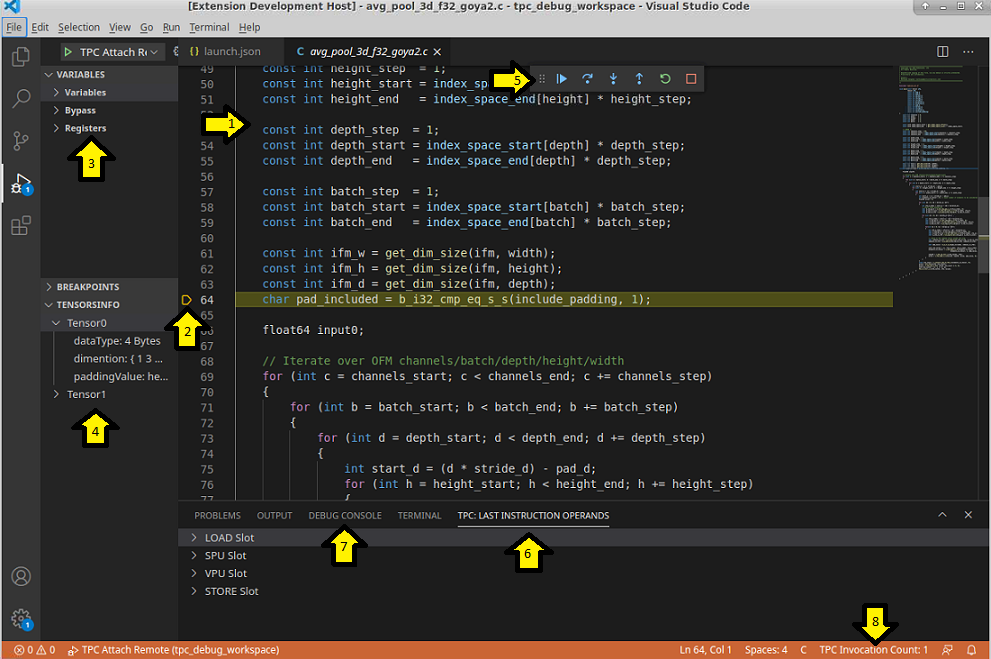
Figure 29 Main View Areas
Each area is described in more details in the following sections:
The main source or disassemble view. See Source View.
The current kernel position indication and breakpoint enable/disable area. See Breakpoint set/unset.
Variables view area showing current values of program variables and TPC registers. See Variables View.
Static tensor information. See Tensor Info View.
Debug start/stop and stepping control. See Debug Start/Stop/Step.
Last executed instruction operands view. See Instruction Operands View.
Debug Console. See Debug Console.
Current TPC invocation number in the status bar. See Debug Start/Stop/Step.
Source View
This is the main area where the current program instruction is shown in either disassembly or TPC-C source level.
Breakpoint set/unset
When hovering over the left side of the source view, marked with yellow arrow number 2 in The main view areas, a dark red dot is visible. When you click on the red dot, a breakpoint is toggled to be enabled or disabled on that line. When setting a breakpoint on source or disassembly line, the actual breakpoint may be set on a different line if the selected line is not a start of instruction as indicated by the debug information, or the selected line does not point to a TPC instruction in disassembly mode. The breakpoint will be set on the next line after the selected line which is a start of a new instruction.
When in TPC-C source level debug mode and the TPC kernel was compiled with optimizations, it is possible that not every source line can be a breakpoint target. This is because of the VLIW architecture of the TPC. The compiler may optimize two different source commands from different source lines to be combined to be executed in parallel on the same TPC instruction.
Conditional Breakpoints
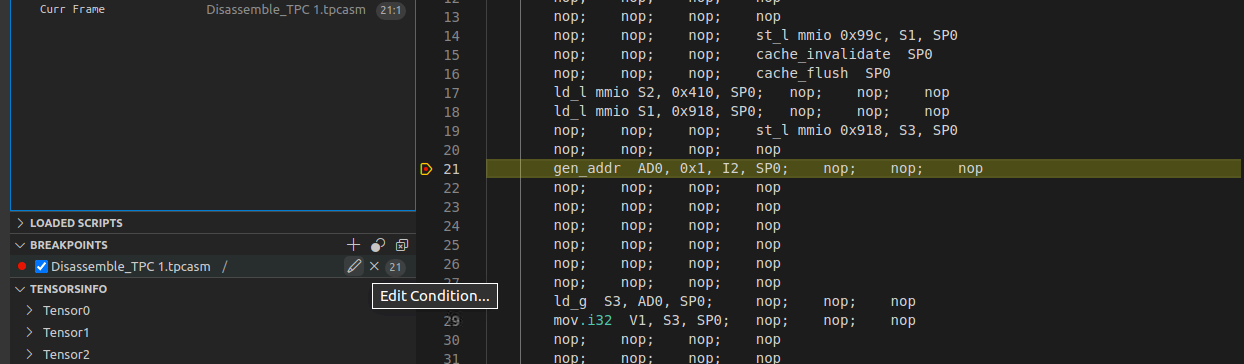
It is possible to set a condition for a line breakpoint. When hovering over a breakpoint in the breakpoints view, you can hit the small “pencil” button to edit the breakpoint condition (see the below Figure).
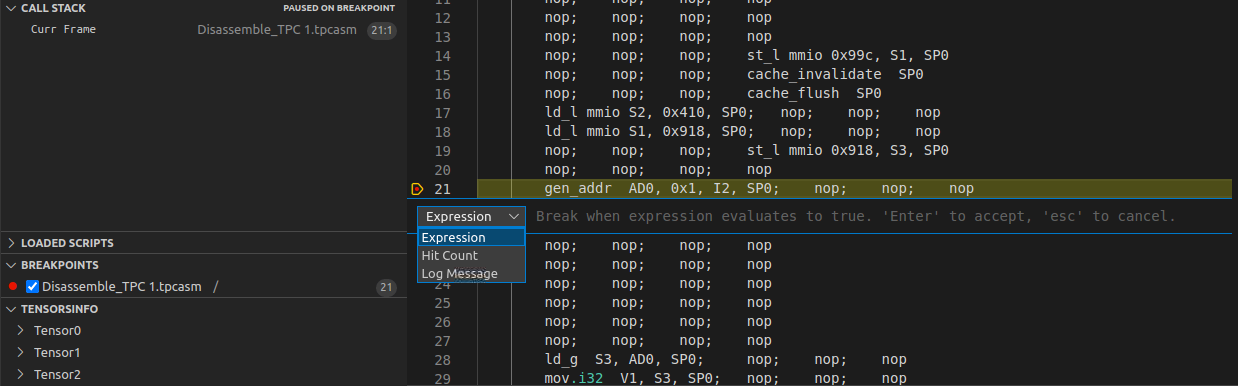
Once hit, you can set three different types of conditions: Expression, Hit Count and Log Message (see the below Figure):
Conditional Breakpoint: Expression When Expression breakpoint is set, you can set an expression that will get evaluated every time the breakpoint location is hit. Program execution will break only when the expression evaluates to true, meaning, its value is not 0.0. See Expression Syntax section for details about the valid Expression syntax.
Conditional Breakpoint: Hit Count When Hit Count is selected, the expression must be a constant integer. The execution will break every N’th time that the breakpoint location is hit. For example: For hit count 3, execution will break every 3rd time the breakpoint location is hit.
Conditional Breakpoint: Log Message When Log Message condition is set, the program execution will not break, instead each time the program execution hits the breakpoint location, the specified message is printed in the debug console. The expression specified is the string of the message; any sub-string which is enclosed in curl brackets is interpreted as an arithmentic expression which gets evaluated when the breakpoint location is hit and the substring get substitutes with the expression value. See Expression Syntax for valid arithmetic expressions.
For example: breakpoint log message of
Got Here S9={S9}will generate the following output to the debug console when the breakpoint location is hit:Got Here S9=uint32'3(in case the value of S9 register equals 3 at the breakpoint location).
Variables View
The Variables View area on the top left side of the debug window displays the current value of program variables and TPC registers as described in the following sections.
Variables
This section will appear only when source level debugging is supported for the debugged TPC kernel, i.e., it was compiled with debug information.
It shows the current value of source level program variables.
Depending on the quality of the debug information data (See Source Level Debugging Limitations), the debugger may not have the backing location for all program variables at each program location. When a value of a program variable cannot be determined, its value is presented as “Unknown”.
The variable value can be modified by clicking on its value and entering a new value,
or by using the set command in the debug console. See set <variable name> <constant value> in Valid Commands for more information.
Bypass
The Bypass section displays values written to TPC registers that were not yet committed. The TPC’s pipeline and bypass architecture defines latency values for different register write operations such that when a register is written by some instruction, the new written value will be visible to other instructions only at the N’th instruction which is executed after the instruction that emit the new value. This N value is the latency.
For each register write operation that has not yet committed, the register name will be displayed followed by the latency value in parenthesis and the write value. The latency value tells you how many instructions should be executed before the register write will be committed.
For example:
S13(5): uint32`4100
The above indicates that a write of value 4100 to SRF register number 13 was issued and the write will be committed within 5 instructions from now. After the register write will be committed, it will no longer be visible in the Bypass, but the register value will be visible in Registers.
When a write operation is made with a predicate to a partial register value only, the parts of the register value that are not touched by the
write operation will be visible as X.
For example:
I2(6): uint32'{0, X, X, X, X}
The above indicates that only the first element of the 5D index register number 2 is written to be 0 and all other 4 elements are unchanged.
Registers
The Registers section shows the current values of all TPC architecture registers.
When the register value is too long, such as VRF registers, only part of the value is visible. It is possible to hover on top of it and a pop-up window will appear with the entire value of the register.
VRF register values are displayed in groups of 32 bytes each:
uint32'{ GRP-0: 1936311911, 3964338001, 2881146153, 1189346290, 4166304380, 2380785691, 1663982198, 2596904755
         GRP-1: 3071095398, 1520654385, 386227493, 3562989912, 3335369387, 290763931, 1098154510, 2279357729
         GRP-2: 2705254768, 1744625985, 2541617470, 2523651306, 710686863, 4214993132, 1413263154, 1557862636
         GRP-3: 1140726274, 984283899, 3872467451, 2491169797, 1639897205, 3143432585, 2500827560, 3018976177
         GRP-4: 16248581, 3845825001, 3502967754, 3177465672, 2820547359, 3311696668, 3311039252, 1668893534
         GRP-5: 610562107, 3691617809, 4071412906, 1001328667, 1357106483, 1544898376, 421687227, 4118649786
         GRP-6: 471523595, 704127871, 320578808, 3897477813, 3761779352, 876432761, 2001625020, 91016186
         GRP-7: 723617452, 2723486378, 1941270718, 3546022971, 2947781686, 2665804002, 1226125903, 2840494845 }
Each register value is prepended with its current display data type. The display data type can be changed by right clicking the register value and selecting the desired data type. When changing the display data type for a specific register, the debugger will remember that setting and will use the same data type for that register. This is also applicable when it shows in the Bypass section.
Some register types will always be displayed using the same data type which cannot be changed. For example, IRF registers will always be displayed as uint32, ADRF registers will always be displayed as hex64, SP registers (Scalar predicates) will always be displayed as hex8.
In order to copy a register value to the clipboard, right click on its value and select “Copy”.
A register value can also be displayed in the Debug Console by specifying its name and optionally display data type. See Debug Console
The variable value can be modified by clicking on its value and entering a new value,
or by using the set_reg command in the debug console. See set_reg <register> <constant value> in Valid Commands for more information.
Tensor Info View
The Tensor Info section displays the configuration of all tensors defined for the kernel. It includes data such as the size of element in the tensor, the tensor dimensions and padding value.
Debug Start/Stop/Step
The set of buttons marked with the yellow arrow 5 in The main view areas provides control for single step, continue and stop kernel execution in the simulator.
The first button from left to right, with the “play” icon, releases the TPC simulator to continue and execute kernel instructions until the next breakpoint is hit. If no breakpoint is hit and the kernel continues to completion, then the debugger will break on the first kernel instruction of the next TPC invocation made by the TPC test program. When the TPC test program finishes with no more TPC invocations, the debug session will disconnect and end. The current number of the TPC invocations can be seen on the status bar at the bottom right of the Visual Studio Code debugger. See the yellow arrow 8 in The main view areas .
The second, third and fourth buttons, with the “Step Over”, “Step Into” and “Step Out” icons, behave in the same way and make the TPC simulator continue kernel execution until the next kernel instruction is hit, if in disassembly debug mode, or until the start of a new source line, if in TPC-C source level debug mode. When “Step Over” is done on a halt instruction, the kernel execution ends and the test program continues execution and will break only on the next TPC kernel invocation made by the program.
The fifth button, with the Restart icon, will stop and then restart the debug session. This will work only if the debug session was configured to automatically start the TPC test program when the debug session starts. See Automatically Launch TPC Test Program on a Local Machine. In this case, the debug session and the test program will stop and then a new debug session will start and the configured TPC test program will get re-launched and attached to it.
Pressing the “Restart” button when the debug session is configured to attach to a running TPC test program will relaunch the debug session that will try to connect to the test program. However, since the test program is no longer communicating with the TCP port, the debugger will fail to connect.
The sixth button, with the “Stop” icon, will stop the debug session. If the debug session is configured to start the TPC test program then the TPC test program will terminate. If the debug session is configured to attach to a running program, the debugger will detach from it and the the test program will continue to run.
Instruction Operands View
When a TPC instruction is executed the value of register operands may be loaded from the registers commit bypass values or only from the register file.
The “TPC: LAST INSTRUCTION OPERANDS” Tab, which is located at the bottom, near the debug console (see yellow arrow 6 in The main view areas), shows the actual operand values used by the last executed instruction. The operation, operand fetch mask and operands values are shown for each of the LOAD, SPU, VPU and STORE instruction slots.
For example, see the below figure.
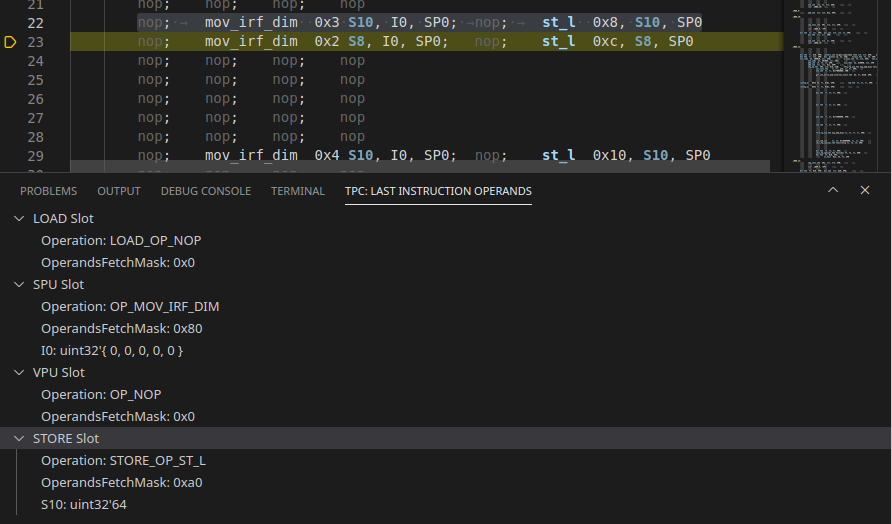
The last executed command was:
nop; mov_irf_dim 0x3 S10, I0, SP0; nop; st_l 0x8, S10, SP0
You can see in the “LAST INSTRUCTION OPERANDS” tab that the operation for the LOAD and VPU slots are NOP. SPU slot executed a MOV operation and the value used for the I0 operand was {0, 0, 0, 0}. The STORE slot executed a store local operation and the value of the S10 operand was 64.
Debug Console
The DEBUG CONSOLE Tab, which is located on the bottom part of the Visual Studio Code window (see yellow arrow 7 in The main view areas) allows sending commands or expressions to be evaluated by the debugger. The command or expression text should be typed in the “>” prompt and when <Enter> is hit it will be evaluated by the debugger and the result will be shown in the console.
Valid Commands
expression
The expression is evaluated and the expression value is displayed. See Expression Syntax for valid expressions.
If the expression includes only a name of a single register, with no arithmentic operations, the register value will be shown. If the register has some pending modifications in the bypass, its value in the register file as well as all bypass values for that register will be shown.
set_reg <register> <constant value>
Set a register value. If the register is a vector register then a subset of element range can be selected to be modified.
See Register Syntax and Constant Value Syntax for more information about the valid syntax for register and value.
Note
Both register expression and value expression may include a data type.
If data type is specified in both expressions, it must be the same data type or
different data types which has the same storage size.
If register is a vector register and value is a vector which includes fewer elements than the selected elements of the register, then the value vector is re-used in a cyclic manner
until all the selected elements of the register are filled. For example, the value string, {0}, can be used to set an entire vector to zeros.
When a register value is set, if it has a pending modification in the bypass that should get committed within N cycles, the pending modification will be processed immediatley before setting the register value.
Note
In this case ALL pending modifications for the N cycles will be processed, and not only the modified register. When this happens, a message will be printed.
Examples
set_reg S10 3- will set the register S10 to value 3.set_reg S10 hex32'0e- will set the register S10 to value 14 (0xe).set_reg V1[0:2]'fp32 {1.0, 2.0, 3.0}- will set the first three elements of V1 to values 1.0, 2.0, 3.0 respectively.set_reg V1'fp32 {1.0}- will fill all the elements of V1 vector with value 1.0.set_reg V1'fp32 fp32'{1.0, 2.0, 3.0}- will fill all the elements of V1 with values of 1.0, 2.0, 3.0, 1.0, 2.0, 3.0, …set_reg V1[0:5]'uint8 uint32'{1}- this is an error, since uint8 and uint32 have different storage sizes.
set <variable name> <constant value>
Set a variable value. This works only in TPC-C debug level mode when debug information is available and the value of the specified variable is known at the current program counter location. The value expression may be a scalar or vector depending on the variable type. See Constant Value Syntax section.
Setting a variable value may have side effects; if the variable storage location is a register that has un-committed modifications in the bypass that should get committed within N cycles, then the pending modification will be processed immediatley before setting the variable value.
Note
In this case ALL pending modifications for the N cycles will be processed, and not only the modified register. When this happens, a message will be printed.
Valid Commands Syntax
Expression Syntax
A basic expression can be a register, variable name or constant value.
Arithmentic expression is a combination of basic expressions combined with basic arithmetic and compare operators.
The supported arithmetic operators are: +, -, *, /, (, ) (plus, minus, multiply, division and parenthesis). Arithmetic operations are performed on floating point scalar values, operands in the expressions are converted to floating point for the calculation. If a vector operand is used, its first element is taken for the calculation. If a specific element was not specified, it means there is no vector arithmetic.
The compare operators are: ==, !=, >, <, >=, <=, ||, &&, ! (equal, not-equal, greater than, less than, greater or equal, less or equal, or, and, not). Compare operators are evaluated to either 0.0 (if compare fails) or 1.0 (if compare passes).
See the following Register Syntax, Constant Value Syntax and Variable Name Syntax sections for more details on basic expression syntax.
Examples
S2 + 2- an expression that evaluates to the current value of SRF register 2 (S2) plus the constant value 2.S3'fp32 + (I0[0] * 2.0)- multiplies the first element of index register zero by 2.0 and adds it to the S3 register value which evaluates as floating point value.V1[8:15]'fp32- the 9’th to 16’th floating point elements stored in VRF register V1.V2 + 3.0- is equivalent to V2[0] + 3.0.V2[2]'fp32 > 0.5- will be equal to 1.0 if the 3rd floating point element of vector register V1 is grater than 0.5, 0.0 otherwise.
Register Syntax
The syntax of a register includes the following components:
A shortcut representing the register file:
S - for SRF
V - for VRF
I - for IRF
SP - for SPRF
VP - for VPRF
The register number within the register file.
Optional for vector register only: specify element sub-range inside the vector register, in the following form:
[i]- to select only the i’th element, it must be a number between 0 and number of elements in the vector minus one.[i:j]- to select range of elements from index i up to index j (included) If a vector sub-range is not specified, the entire vector is selected.
Optional: specify the data type to use for interpreting the register value, using the following syntax: “tag” character (’) followed by data type string. See Supported data type strings for valid data types.
Examples
S10- SRF regiser 10.S10'fp32- SRF register 10 interpreted as floating point value.V1- VRF register 1.V2[4:6]'fp32- the 5’th to 7’th (index 4 to 6) floating point elements of VRF register 2.
Constant Value Syntax
Constant value can be a scalar value string, or a vector specified as comma separeted value strings within curl brackets.
A vector constant can optionally be prepended by a data type string followed by the “tag” character (‘). When specified, it is used to interpret the constant values inside the curl brackets.
If a data type is not specified, then the data type to be used is deduced from the command; for example, if the constant value is part of a set_reg or set command, then the
data type of the register or variable is used. If the data type cannot be deduced from the command, an error is reported, in such cases specifying a data type is mandatory.
Examples
1.0- The floating point value 1.0.
uint8'{1, 2, 3, 4}- A vector of 4 uint8 numbers with values 1, 2, 3, 4.
{1, 2, 3}- A vector of three, data type must be deduced from the other operands of the command, otherwise it is an error.
Variable Name Syntax
When TPC-C source level debugging is available for the debugged kernel (See TPC-C Source or Disassembly Level Debugging) , then a source level variable name can be used in an expression and will get evaluated to its current value. If the value of the variable is unknown at the current program location due to lack of debug information, then the entire expression value becomes “unknown”.
The following table describes the supported data type strings.
Data type string |
Description |
|---|---|
int8 |
8-bit signed integer |
uint8 |
8-bit unsigned integer |
bool |
8-bit boolean value (1 indicates value != 0) |
int16 |
16-bit signed integer |
uint16 |
16-bit unsigned integer |
int32 |
32-bit signed integer |
uint32 |
32-bit unsigned integer |
int64 |
64-bit signed integer |
int4 |
4-bit signed integer |
uint4 |
4-bit unsigned integer |
fp32 |
32-bit floating point |
fp16 |
16-bit floating point |
bf16 |
16-bit bfloat |
fp8_152 |
8-bit floating point with 5-bits exponent and 2-bits mantissa |
fp8_143 |
8-bit floating point with 4-bits exponent and 3-bits mantissa |
hex8 |
8-bit unsigned integer shown in hexadecimal base |
hex16 |
16-bit unsigned integer shown in hexadecimal base |
hex32 |
32-bit unsigned integer shown in hexadecimal base |
hex64 |
64-bit unsigned integer shown in hexadecimal base |
Memory View
The memory view allows you to display selected areas of SLM, VLM, MMIO or TENSORS.
To open the memory view, right click the main source view and select “TPC Memory View”. A new editor tab will open where you can select the desired memory type in the displayed option menu.
Multiple memory views can be opened, each to display a different memory area. The life cycle of each memory view is until the current TPC kernel invocation is ended. After the TPC kernel has finished, the memory view buttons will be grayed out and disabled.
The following sections describe each memory type.
SLM
When selecting the SLM memory type, the total size of Scalar Local Memory is displayed. SLM values are always displayed as 32-bit elements. You can select the data type and range of SLM elements to view. Once the “Apply” button is pressed, a table with the SLM memory content will be displayed as shown in the following figure:
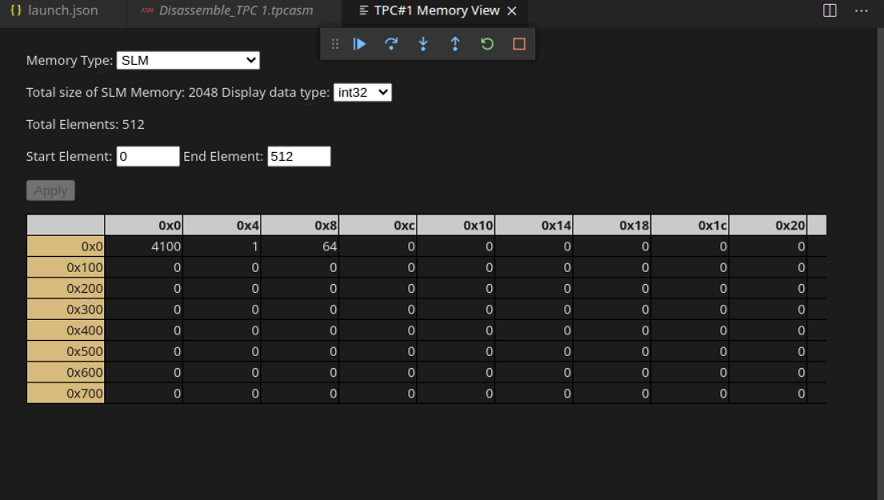
When SLM memory is modified within the displayed range, the values in the table will be automatically updated and will stay up-to-date.
Memory cells can be edited and assigned different values. See Cell Editing in Memory View.
VLM
When selecting the VLM memory type, the total size of Vector Local Memory is displayed. Each VLM element is 256-bytes long which is interpreted as an array of a selected data type. After selecting the desired data type and range of VLM elements to display, pressing on the “Apply” button will display the VLM content in a table as shown in the following figure:
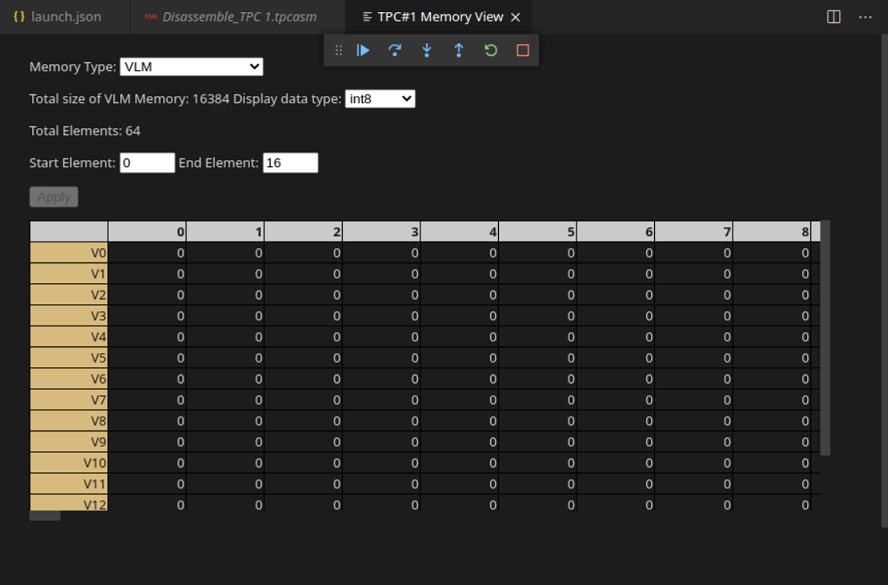
When VLM memory is modified within the displayed range, the values in the table will be automatically updated and will stay up-to-date.
Memory cells can be edited and assigned different values. See Cell Editing in Memory View.
MMIO
When selecting the MMIO memory type, the total size of MMIO configuration space is displayed. MMIO values are displayed always as 32-bit elements, You can select the data type and range of MMIO elements to view. Once the “Apply” button is pressed, a table with the configuration memory content will be displayed as shown in the following figure:
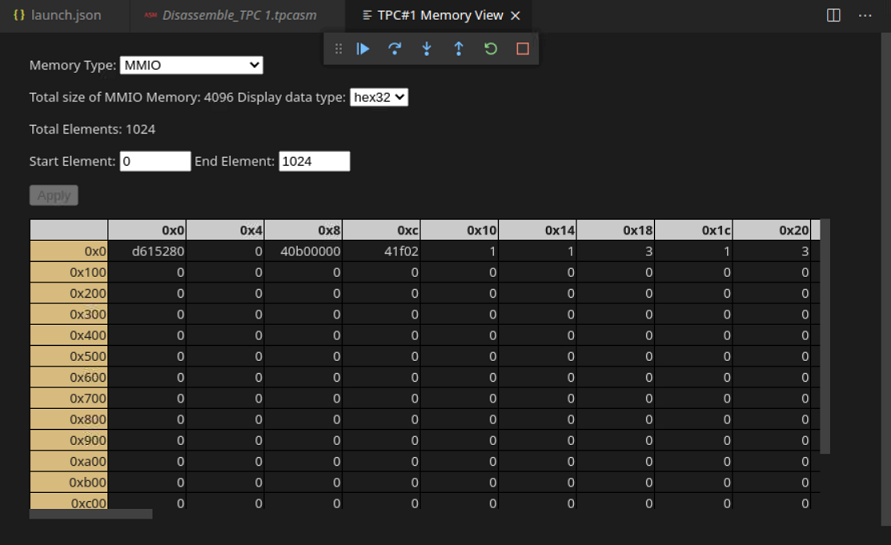
When MMIO memory is modified within the displayed range, the values in the table will be automatically updated and will stay up-to-date.
Memory cells can be edited and assigned different values. See Cell Editing in Memory View.
TENSOR
The Tensor memory type allows you to view a two dimensional slice of data of up to 5 dimensional tensor.
The view allows you to select the desired tensor number, the display data type and the 5D index range of the 2D slice. The “Start index” is the 5D index of the first location in the tensor, the “End index” is the last index to be shown. The start and stop index value at each dimension should match. Only two dimensions can be set to a range larger than 1. These two dimensions define the 2D slice to be displayed.
Once you select the slice, press the “Apply” button to display the tensor content in a table. Each axis of the 2D slice is marked with a different background color which matches the displayed data table. For example:
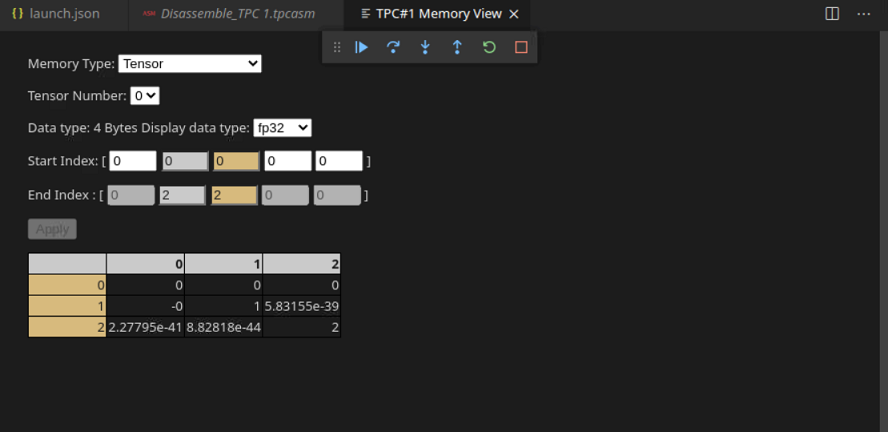
When TENSOR memory is modified within the displayed range, the values in the table will be automatically updated and will stay up-to-date.
Memory cells can be edited and assigned different values. See Cell Editing in Memory View.
Cell Editing in Memory View
Any cell in the memory view table can be clicked and a new value can be typed. Once <Enter> is hit, the memory location will be modified with the new value.
The new value string is interpreted as the selected data type for the memory view. A different data type string can be specified by prepending the
desired data type string followed by the “tag” character (‘). For example, the following value is equal the integer value 15: hex32'f.
See Supported data type strings for possible data type strings.