Remote Trace Viewer Tool
On this Page
Remote Trace Viewer Tool
The Remote Trace Viewer (RTV) tool allows you to load, view, and analyze multiple large trace profiles simultaneously.
It runs entirely on your local machine. Normally the habana-perfetto application
loads a trace directly in its built-in viewer. For large traces that exceed the
in-app (WASM) memory limit, you can optionally run trace_processor_shell
(the app’s backend) manually on the trace file; the app then connects to it
locally over an RPC port instead of loading the file in-process.
Note
RTV currently supports the habana-perfetto application profile viewer only. For further details, refer to Getting Started with Intel Gaudi Profiler.
The following features are included in the tool:
Avoids Memory Constraints - Bypasses the WASM Trace Processor Out-of-Memory error encountered when loading large (multi-GB) trace files in the in-app viewer.
Facilitates Comparative Analysis - Allows for active comparative analysis of multiple trace profiles simultaneously.
Prerequisites
Read access rights to the trace profile on the local machine.
Using RTV
To download the RTV tool, open the habana-perfetto application, select from left bar “Trace Processor Shell” and download the tool.
Open a terminal window and navigate to the directory where the
trace_processor_shellwas downloaded.Execute the script with the following arguments:
Linux: ./trace_processor_shell --httpd --http-port <PORT_NUMBER> <TRACE_FILE_PATH>
<TRACE_FILE_PATH>is the full path to the trace profile on the local machine.<PORT_NUMBER>is the port number used to create a socket for viewing the trace at the habana-perfetto application. The default port is 9001.
Wait for the trace file to load. The script starts loading the trace file. Allow the file to fully load, and upon completion, a confirmation message indicating the successful loading of the trace will appear. For example:
processor_shell.cc:1636 Trace loaded: 3671.31 MB in 197.14s (18.6 MB/s)
Launch the app with the same
PORT_NUMBERused in Step 3, so it connects to the runningtrace_processor_shell. Replace 9002 in this command with thatPORT_NUMBER.habana-perfetto --rpc-port=9002
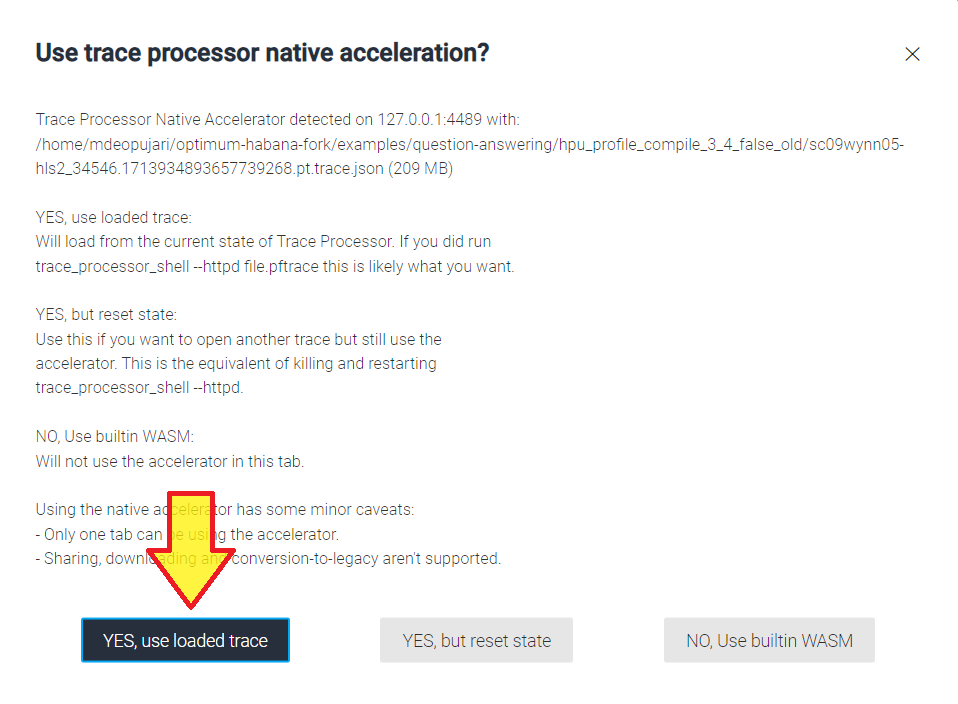
Select the native accelerator. To load the trace file, in your app, select “YES, use loaded trace” button as shown in the screenshot below.
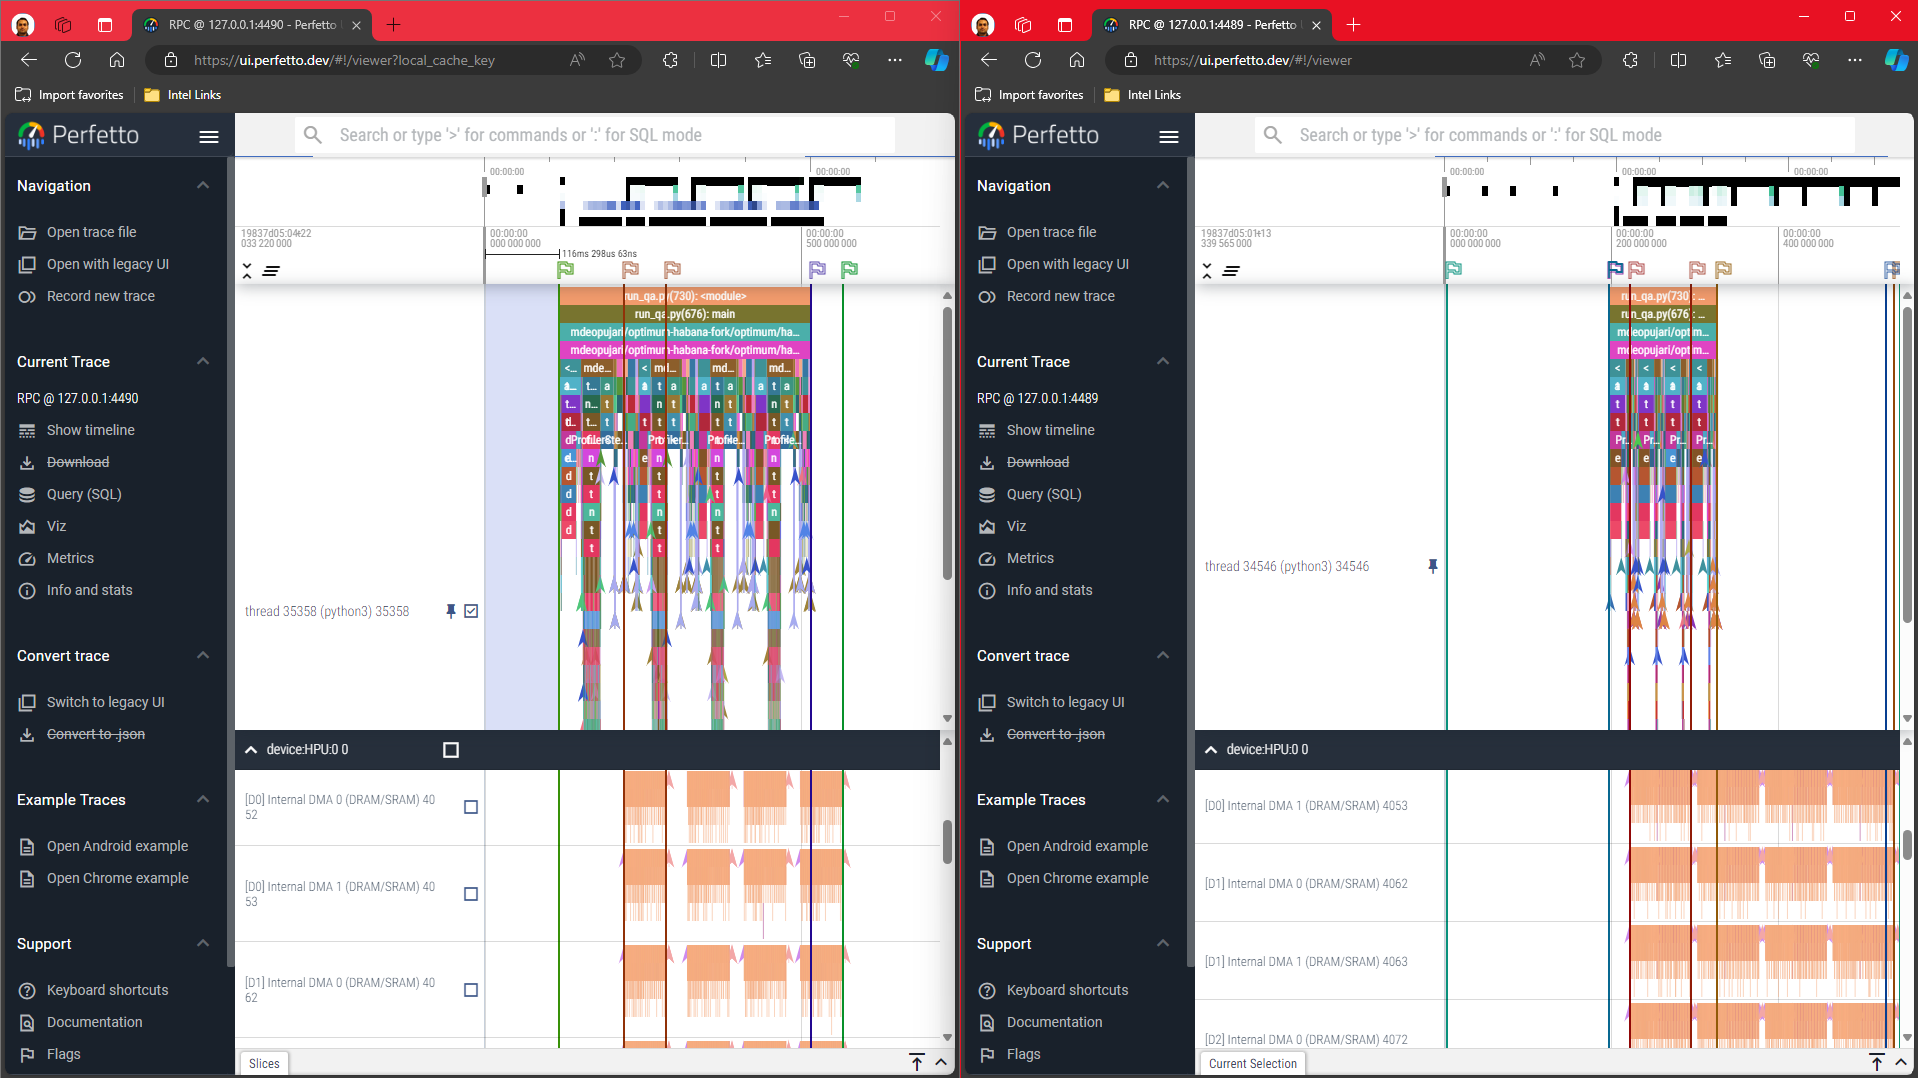
(Optional) Run Steps 2-5 to load more trace files on a different port number. Every new trace is opened in a new tab, allowing the user to view multiple active traces at once, and comparing them. If you wish to open traces on different ports, you will need to run multiple instances of the habana-perfetto application, one for each port.
Security and Data Handling
Everything runs locally. The app loads only the trace files you open and does
not transmit trace data or usage information off the machine. When run, the
trace_processor_shell backend listens on localhost only and is
not reachable from the network.
Troubleshooting
When starting a new trace viewing session on a previously used port number, the following error message may appear:
http_server.cc:63 Failed to listen on IPv4 socket: "127.0.0.1:9001" (errno: 98, Address already in use)
This occurs because the trace_processor_shell process from a previous session might still be running,
even after the session has been disconnected.
To resolve this, you have the following options:
Use a different port number for your new trace viewing session.
Stop the
trace_processor_shellprocess manually, and restart the session. Make sure to use thelsof -iLinux command to find the process ID (PID) oftrace_processor_shell, andkill -9 <PID>command to terminate the identified process.