Profiling with vLLM
On this Page
Profiling with vLLM
This chapter provides multiple approaches for profiling vLLM, helping to understand time utilization, detect bottlenecks, and analyze both host and device behavior during inference. vLLM supports the following methods of collecting performance traces:
Profiling Method |
Category |
Detail Level |
Use Case |
|---|---|---|---|
Comprehensive profiling |
High |
Capturing of all profiling data across host, Python, and device. |
|
High-level profiling |
Low |
Debugging prompt/decode structure, batch sizes, and scheduling patterns. |
|
Server-based profiling |
Medium |
Measuring latency, host gaps, and server response timing. |
|
Script-based profiling |
Medium |
Profiling within test scripts. |
|
Device-level profiling |
Medium/High |
Capturing of a general execution flow without graph details (no shapes, ops). Optionally, analysis of fused ops, node names, graph structures, and timing. |
E2E Profiling
E2E profiling captures all relevant data in a single run, combining:
High-level profiling
PyTorch profiling via asynchronous server
PyTorch profiling via script
This unified method allows to collect all traces in a single file, while retaining control over when to start and stop trace collection. It simplifies analysis by consolidating all profiling data but has a drawback of increased size of the trace file, making it harder to analyze in browsers or tools like Perfetto. To avoid generating large trace files, it is recommended to use methods included within E2E profiling separately when full trace is not required.
Note
While HW traces can be collected, it is not recommended with E2E profiling due to the trace file size. For hardware-level profiling, refer to Profiling Specific Prompt or Decode Execution.
Due to the large amount of data collected during E2E profiling, Python stack events in the PyTorch Profiler are disabled by default. If Python stack events are required, use either PyTorch Profiling via Asynchronous Server or PyTorch Profiling via Script, as both methods collect these events by default.
To execute E2E profiling:
Disable HW tracing to reduce the trace size. Skip this step if you want to collect the HW traces:
hl-prof-config --use-template profile_api --hw-trace off
export HABANA_PROFILE=1
Enable E2E profiling:
export VLLM_PROFILER_ENABLED=full
Set the output directory:
export VLLM_TORCH_PROFILER_DIR=/tmp
Configure start and stop points for trace collection based on your application setup depending on whether you are profiling a server running in a separate process or a standalone Python script:
Start the vLLM server. The below example uses the facebook/opt-125m model, TP=1 with max batch size 128:
VLLM_PROMPT_SEQ_BUCKET_MAX=128 VLLM_PROMPT_SEQ_BUCKET_MIN=128 \
python3 -m vllm.entrypoints.openai.api_server --port 8080 \
  --model "facebook/opt-125m" --tensor-parallel-size 1 \
  --max-num-seqs 128 --dtype bfloat16 \
  --max-model-len 256
Wait until the warmup is completed and start profiling:
curl -X POST http://localhost:8080/start_profile
Send requests for profiling:
curl http://localhost:8080/v1/completions \
  -H "Content-Type: application/json" \
  -d '{
    "model": "facebook/opt-125m",
    "prompt": "San Francisco is a",
    "max_tokens": 7,
    "temperature": 0
}'
Stop profiling:
curl -X POST http://localhost:8080/stop_profile
Start the vLLM server. The below example uses the facebook/opt-125m model, TP=1 with max batch size 128:
VLLM_PROMPT_SEQ_BUCKET_MAX=128 VLLM_PROMPT_SEQ_BUCKET_MIN=128 \
python3 -m vllm.entrypoints.openai.api_server --port 8080 \
  --model "facebook/opt-125m" --tensor-parallel-size 1 \
  --max-num-seqs 128 --dtype bfloat16 \
  --max-model-len 256
Install the
datasetspackage:pip install datasets
Send requests for profiling (using the vllm-fork):
python benchmarks/benchmark_serving.py \
     --backend vllm \
     --model "facebook/opt-125m" \
     --port 8080 \
     --dataset-name "random" --random-input-len 128 --random-output-len 4 \
     --random-range-ratio 1.0 \
     --ignore-eos \
     --profile \
     --max-concurrency "4" \
     --request-rate "inf" \
     --num-prompts 4 \
     --percentile-metrics "ttft,tpot,itl,e2el"
Enable tracing in the script by instructing the LLM object to start and stop profiling:
from vllm import LLM, SamplingParams
llm = LLM(model="facebook/opt-125m")
llm.start_profile() # Start profiling
outputs = llm.generate(["San Francisco is a"])
llm.stop_profile() # Stop profiling
As a result, a vllm(...).pt.trace.json.gz is generated and can be viewed from Perfetto:
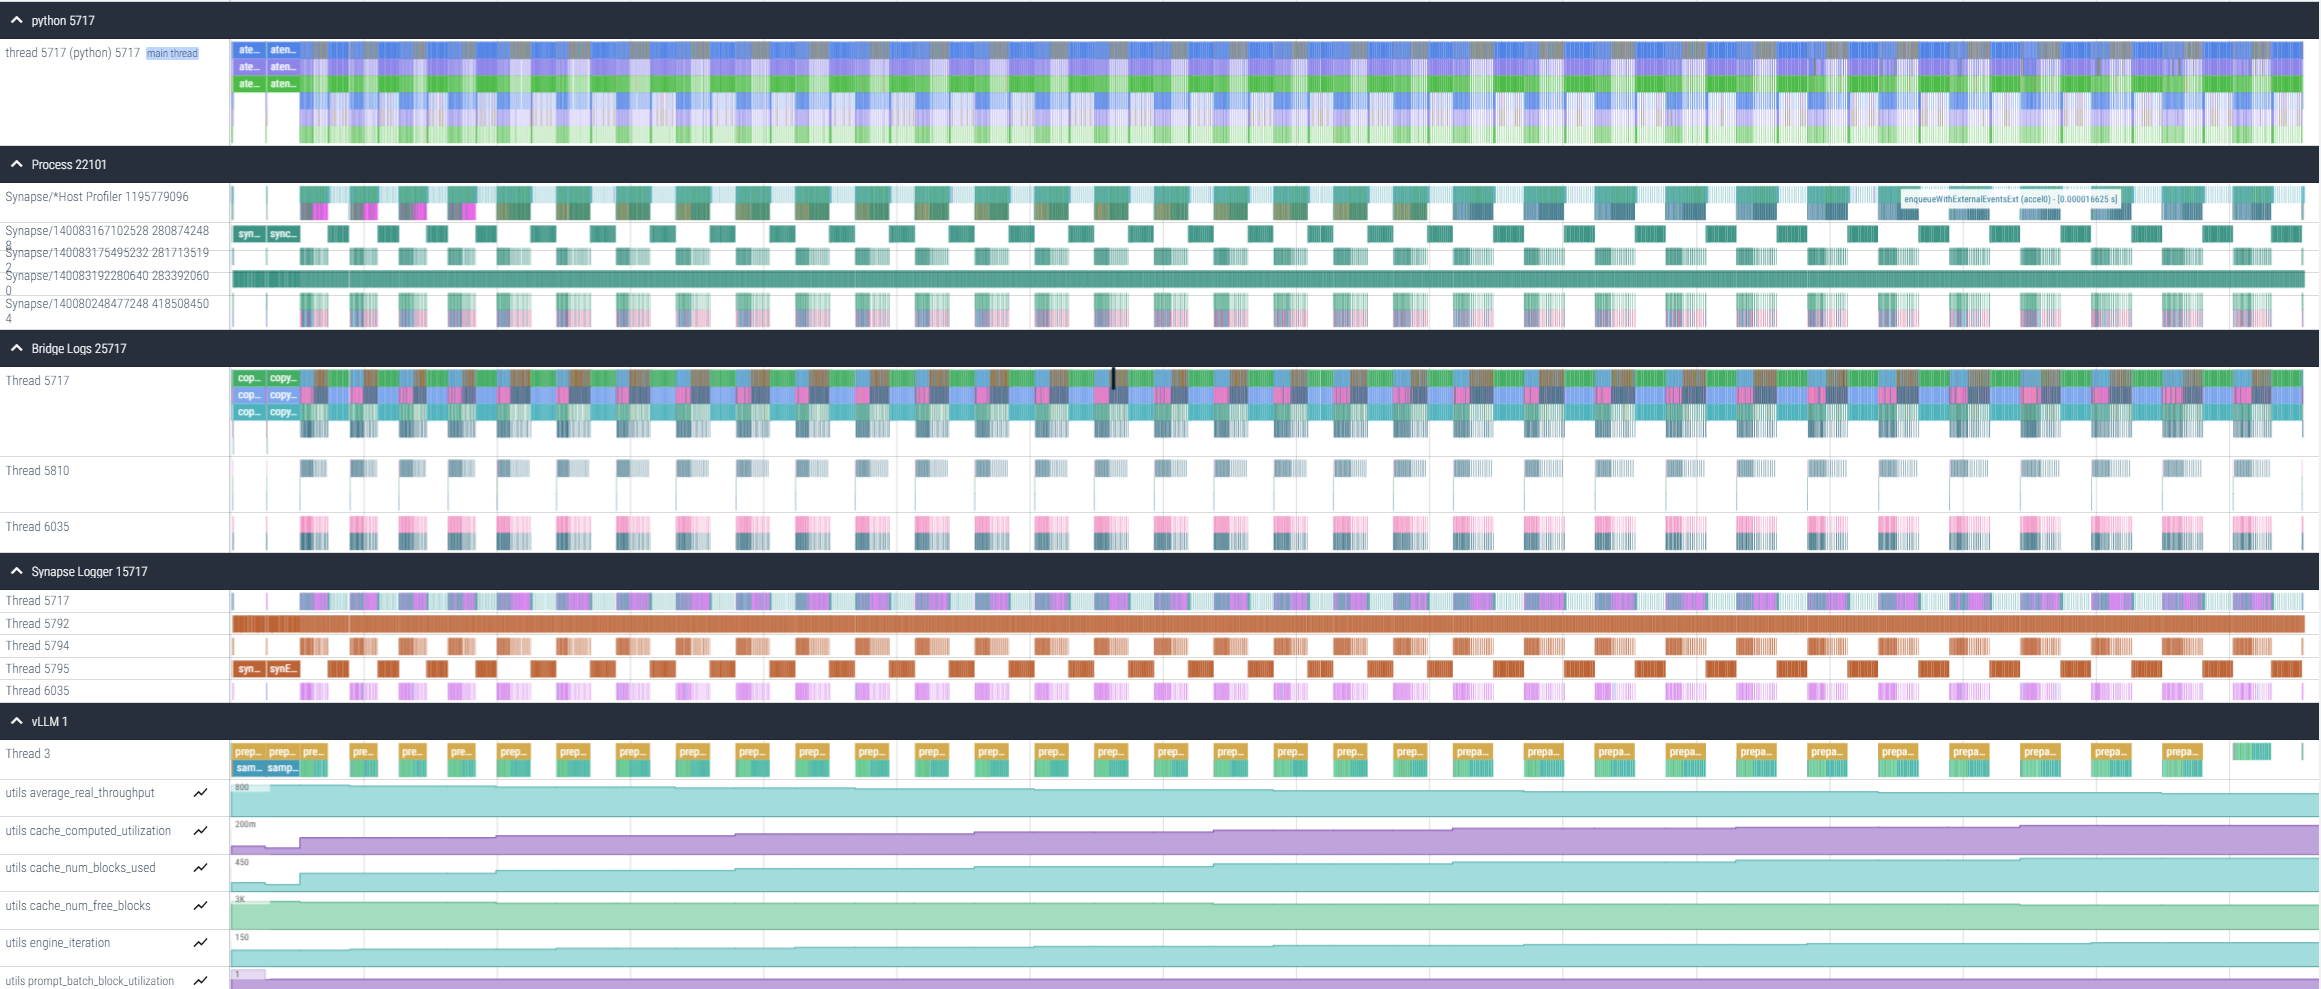
This file provides information about:
Host gaps
Prompt and decode durations
Recompilation events
Python execution times
High-Level Profiling
Note
This method is included with E2E profiling. No need to repeat if already performed.
Due to the dynamic nature of serving inference - where prompts and decodes may arrive on unpredictable schedules and run over extended periods - it is often useful to gain visibility into what is actually being executed. High-level profiling does not accurately represent the real execution time of prompt or decode phases. This limitation is due to the asynchronous measurement approach used. For example, in scenarios involving delayed sampling or multi-step scheduling, the system avoids synchronizing the host with the device solely to indicate when the device has paused execution. Doing so would negatively impact performance. Therefore, the time recorded for each prompt or decode phase reflects host-side timing only, and should therefore be interpreted with caution.
High-level profiling is enabled with the export VLLM_PROFILER_ENABLED=true flag.
As a result, a server_events(...).json file is generated and can be viewed from Perfetto:
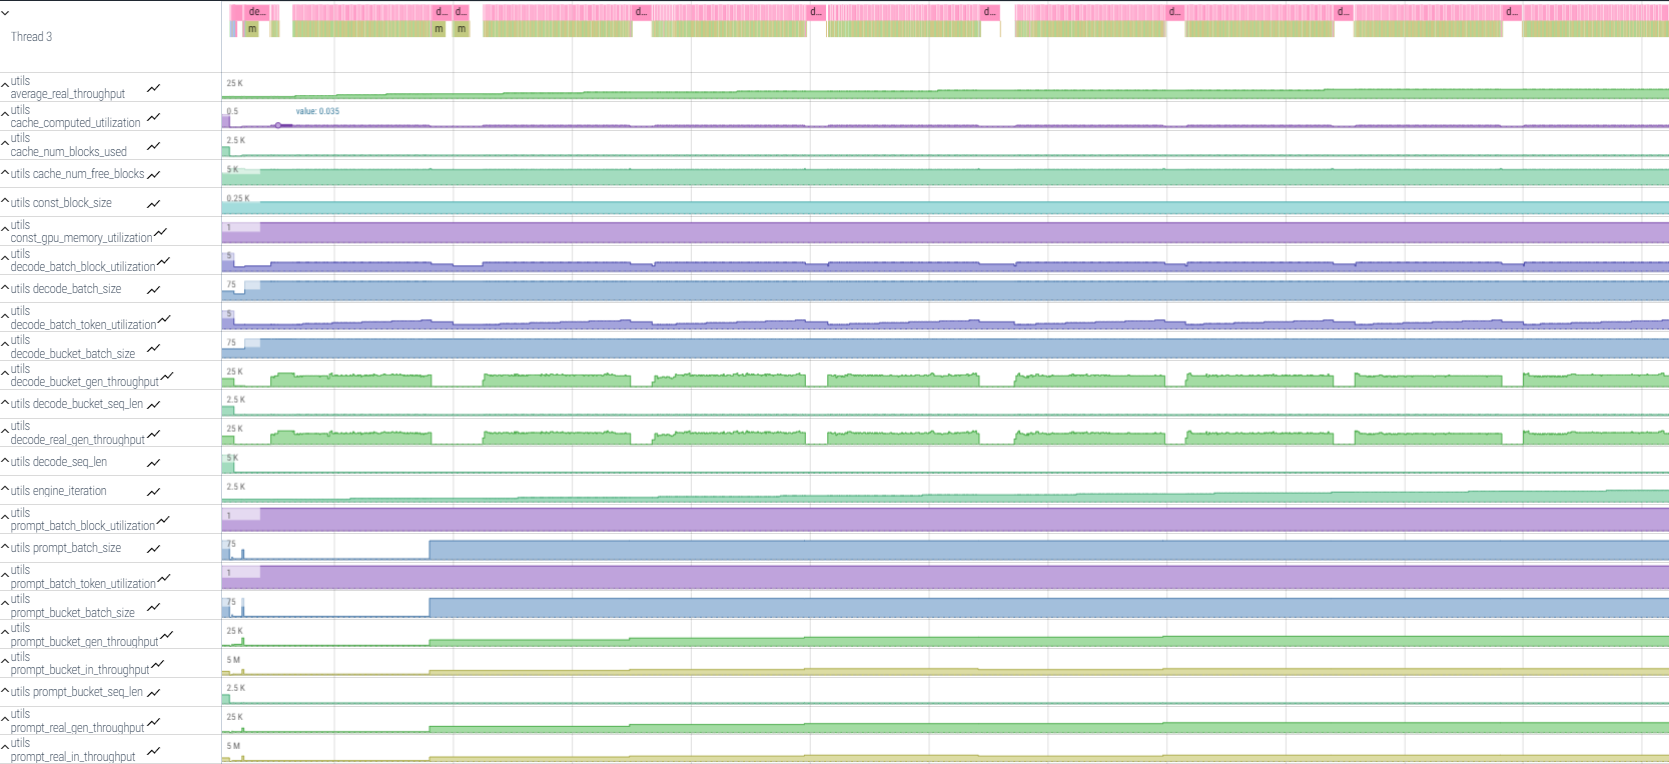
This file provides debug information about:
Prompt and decode batch sizes
Input lengths
Number of blocks used
Decode and prompt buckets used for seq_len and batch size, and more
This information is presented in a timeline with minimal trace size.
PyTorch Profiling via Asynchronous Server
Note
This method is included with E2E profiling. No need to repeat if already performed.
While HW traces can be collected, it is not recommended with profiling via asynchronous server due to the trace file size. For hardware-level profiling, refer to Profiling Specific Prompt or Decode Execution.
To profile a vLLM server using PyTorch tracing tools:
Disable HW tracing to reduce the trace size. Skip this step if you want to collect the HW traces:
hl-prof-config --use-template profile_api --hw-trace off
Set the output directory:
export VLLM_TORCH_PROFILER_DIR=/tmp
Start the vLLM server. The below example uses the facebook/opt-125m model, TP=1 with max batch size 128:
VLLM_PROMPT_SEQ_BUCKET_MAX=128 VLLM_PROMPT_SEQ_BUCKET_MIN=128 \
python3 -m vllm.entrypoints.openai.api_server --port 8080 \
  --model "facebook/opt-125m" --tensor-parallel-size 1 \
  --max-num-seqs 128 --dtype bfloat16 \
  --max-model-len 256
Wait until the warmup is completed and start profiling:
curl -X POST http://localhost:8080/start_profile
Send requests for profiling:
curl http://localhost:8080/v1/completions \
  -H "Content-Type: application/json" \
  -d '{
    "model": "facebook/opt-125m",
    "prompt": "San Francisco is a",
    "max_tokens": 7,
    "temperature": 0
}'
Stop profiling:
curl -X POST http://localhost:8080/stop_profile
Disable HW tracing to reduce the trace size. Skip this step if you want to collect the HW traces:
hl-prof-config --use-template profile_api --hw-trace off
Set the output directory:
export VLLM_TORCH_PROFILER_DIR=/tmp
Start the vLLM server. The below example uses the facebook/opt-125m model, TP=1 with max batch size 128:
VLLM_PROMPT_SEQ_BUCKET_MAX=128 VLLM_PROMPT_SEQ_BUCKET_MIN=128 \
python3 -m vllm.entrypoints.openai.api_server --port 8080 \
  --model "facebook/opt-125m" --tensor-parallel-size 1 \
  --max-num-seqs 128 --dtype bfloat16 \
  --max-model-len 256
Install the
datasetspackage:pip install datasetsSend requests for profiling (using the vllm-fork):
python benchmarks/benchmark_serving.py \
     --backend vllm \
     --model "facebook/opt-125m" \
     --port 8080 \
     --dataset-name "random" --random-input-len 128 --random-output-len 4 \
     --random-range-ratio 1.0 \
     --ignore-eos \
     --profile \
     --max-concurrency "4" \
     --request-rate "inf" \
     --num-prompts 4 \
     --percentile-metrics "ttft,tpot,itl,e2el"
As a result, a *.pt.trace.json.gz file is generated and can be viewed from Perfetto:
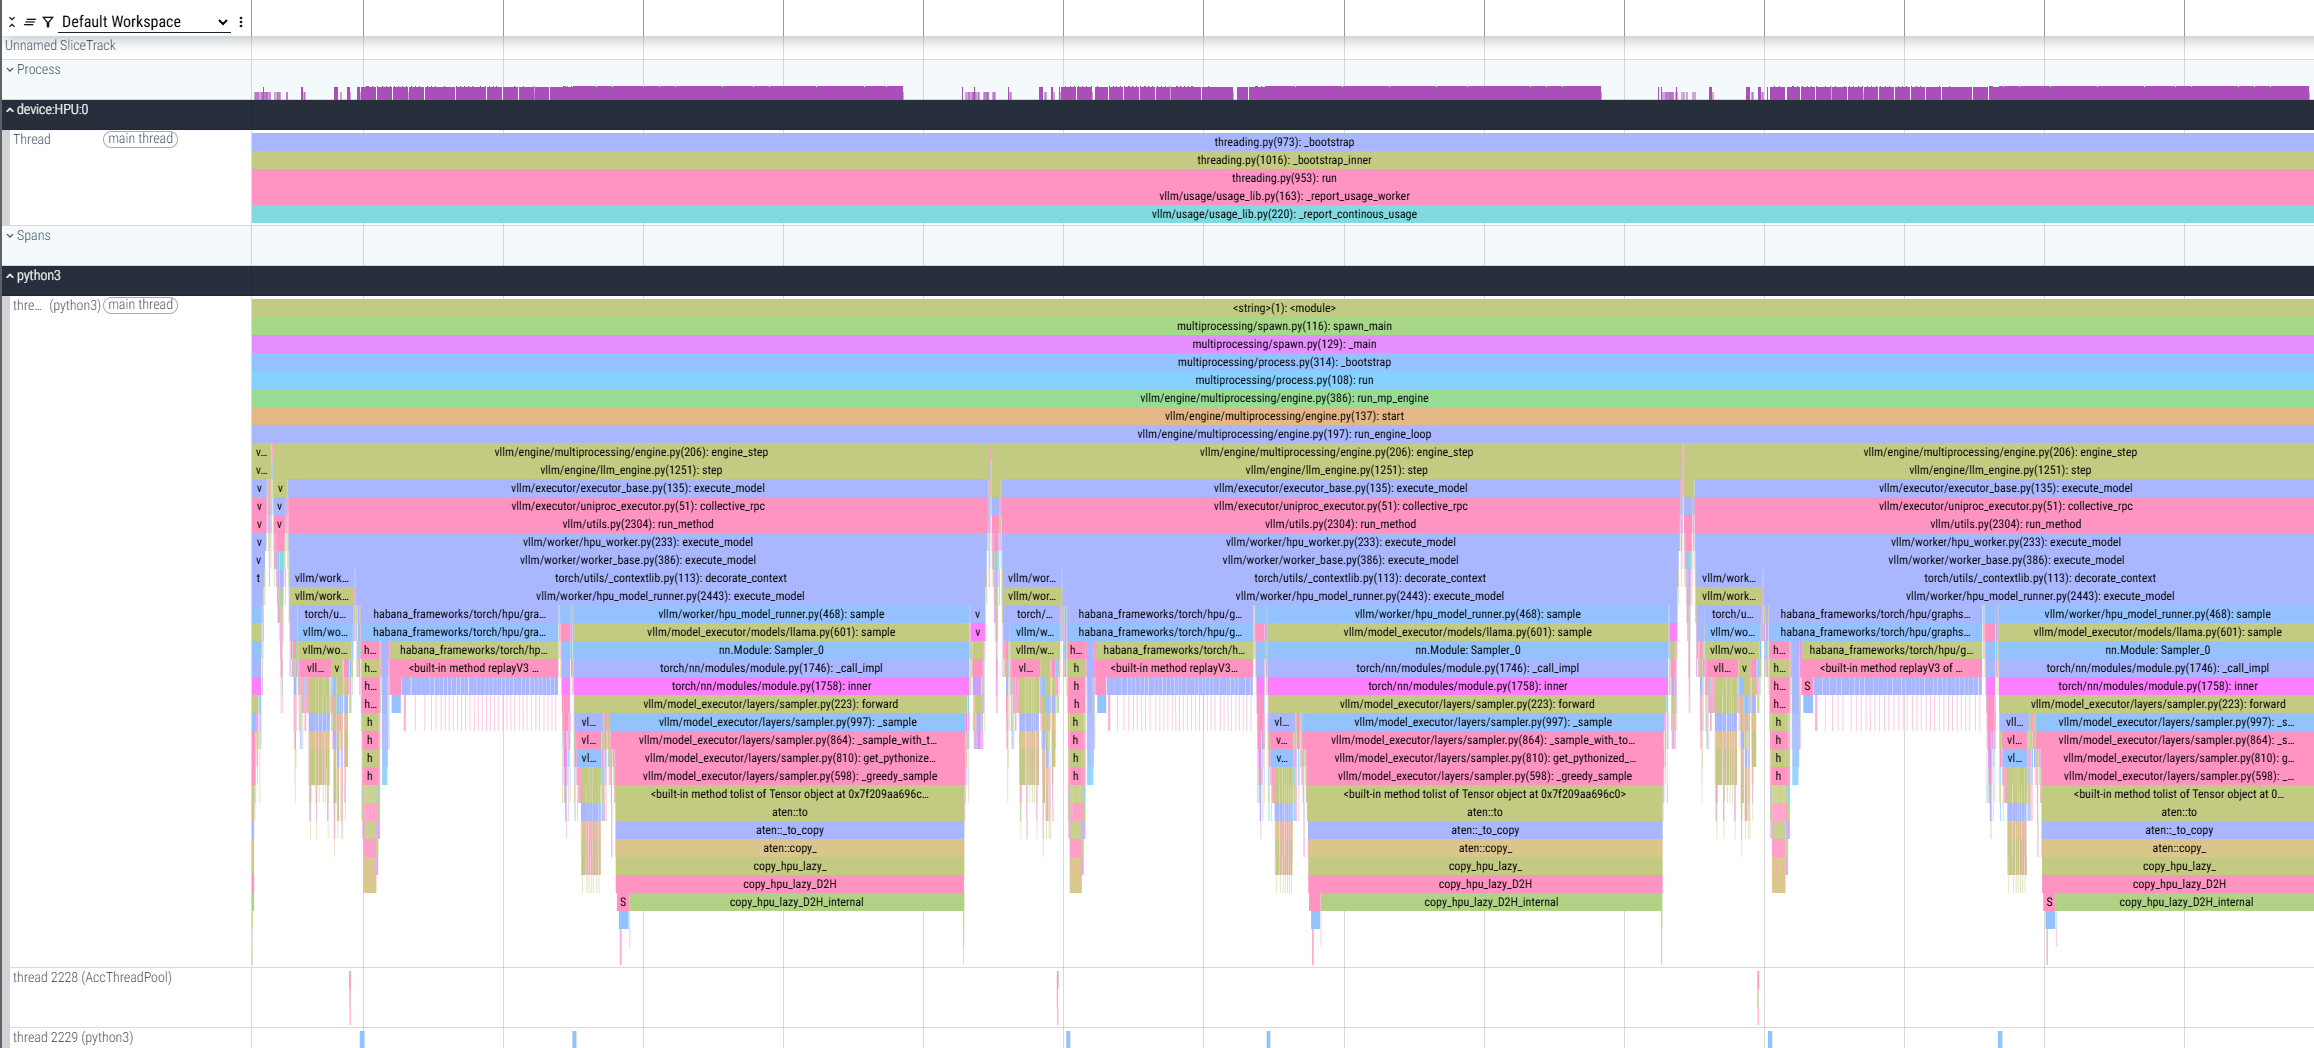
The file shows profiling of multiple prompts and decodes, where decode operations are measured, and host-side gaps between them can also be observed for analysis.
PyTorch Profiling via Script
Note
This method is included with E2E profiling. No need to repeat if already performed.
To trace specific portions of code in standalone Python scripts using PyTorch tracing tools:
Set the output directory:
export VLLM_TORCH_PROFILER_DIR=/tmp
Enable tracing in the script by instructing the LLM object to start and stop profiling:
from vllm import LLM, SamplingParams
llm = LLM(model="facebook/opt-125m")
llm.start_profile() # Start profiling
outputs = llm.generate(["San Francisco is a"])
llm.stop_profile() # Stop profiling
As a result, a *.pt.trace.json.gz file is generated and can be viewed from Perfetto.
Profiling Specific Prompt or Decode Execution
This method provides basic CPU and HPU profiling information, such as timeline and duration of operations. To execute the profiling, perform the following:
Define the profiling scope using the following format:
VLLM_PT_PROFILE=<phase>_<batch_size>_<size>_<hpu_graph_flag>
Where:
<phase>- Prompt or decode<batch_size>- Batch size to profile<size>- Input length (for prompt) or number of blocks (for decode)<hpu_graph_flag>- t (true) to include HPU graph, f (false) to exclude
Examples:
Profile decode with batch size 256, 2048 blocks, and HPU graphs:
VLLM_PT_PROFILE=decode_256_2048_t
Profile prompt with batch size 16, input length 128, and HPU graphs:
VLLM_PT_PROFILE=prompt_16_128_t
Run your inference command with the appropriate profiling flag. For example:
VLLM_PT_PROFILE=decode_256_2048_t python3 -m vllm.entrypoints.openai.api_server \
  --port 8080 \
  --model "facebook/opt-125m" \
  --tensor-parallel-size 1 \
  --max-num-seqs 256 \
  --dtype bfloat16 \
  --max-model-len 256
This profiling mode ends with an intentional assertion after collecting the requested trace. This is expected behavior, and the profiling data is successfully collected.
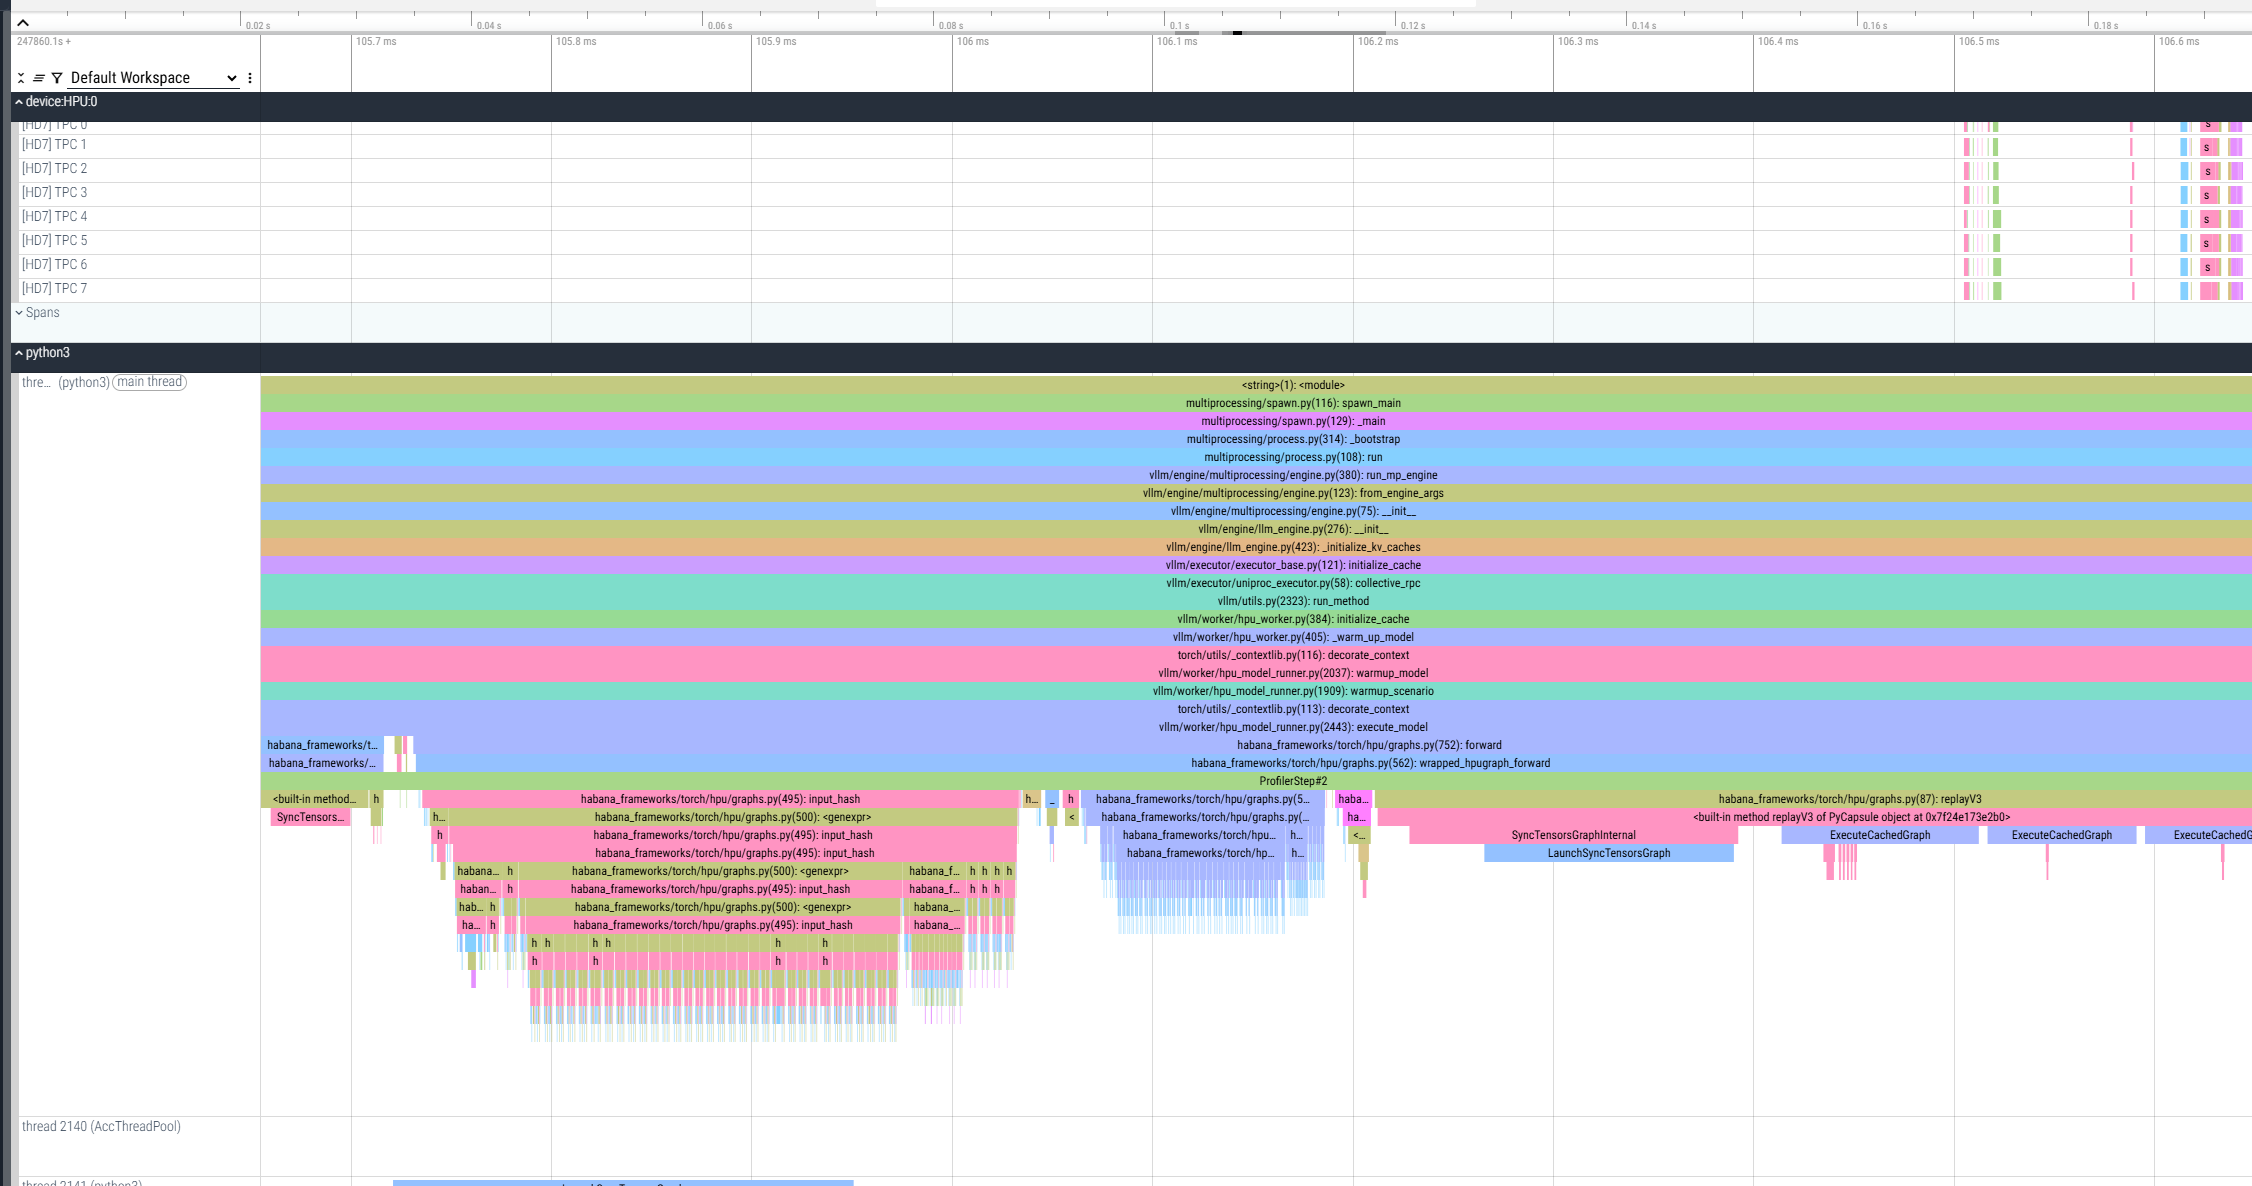
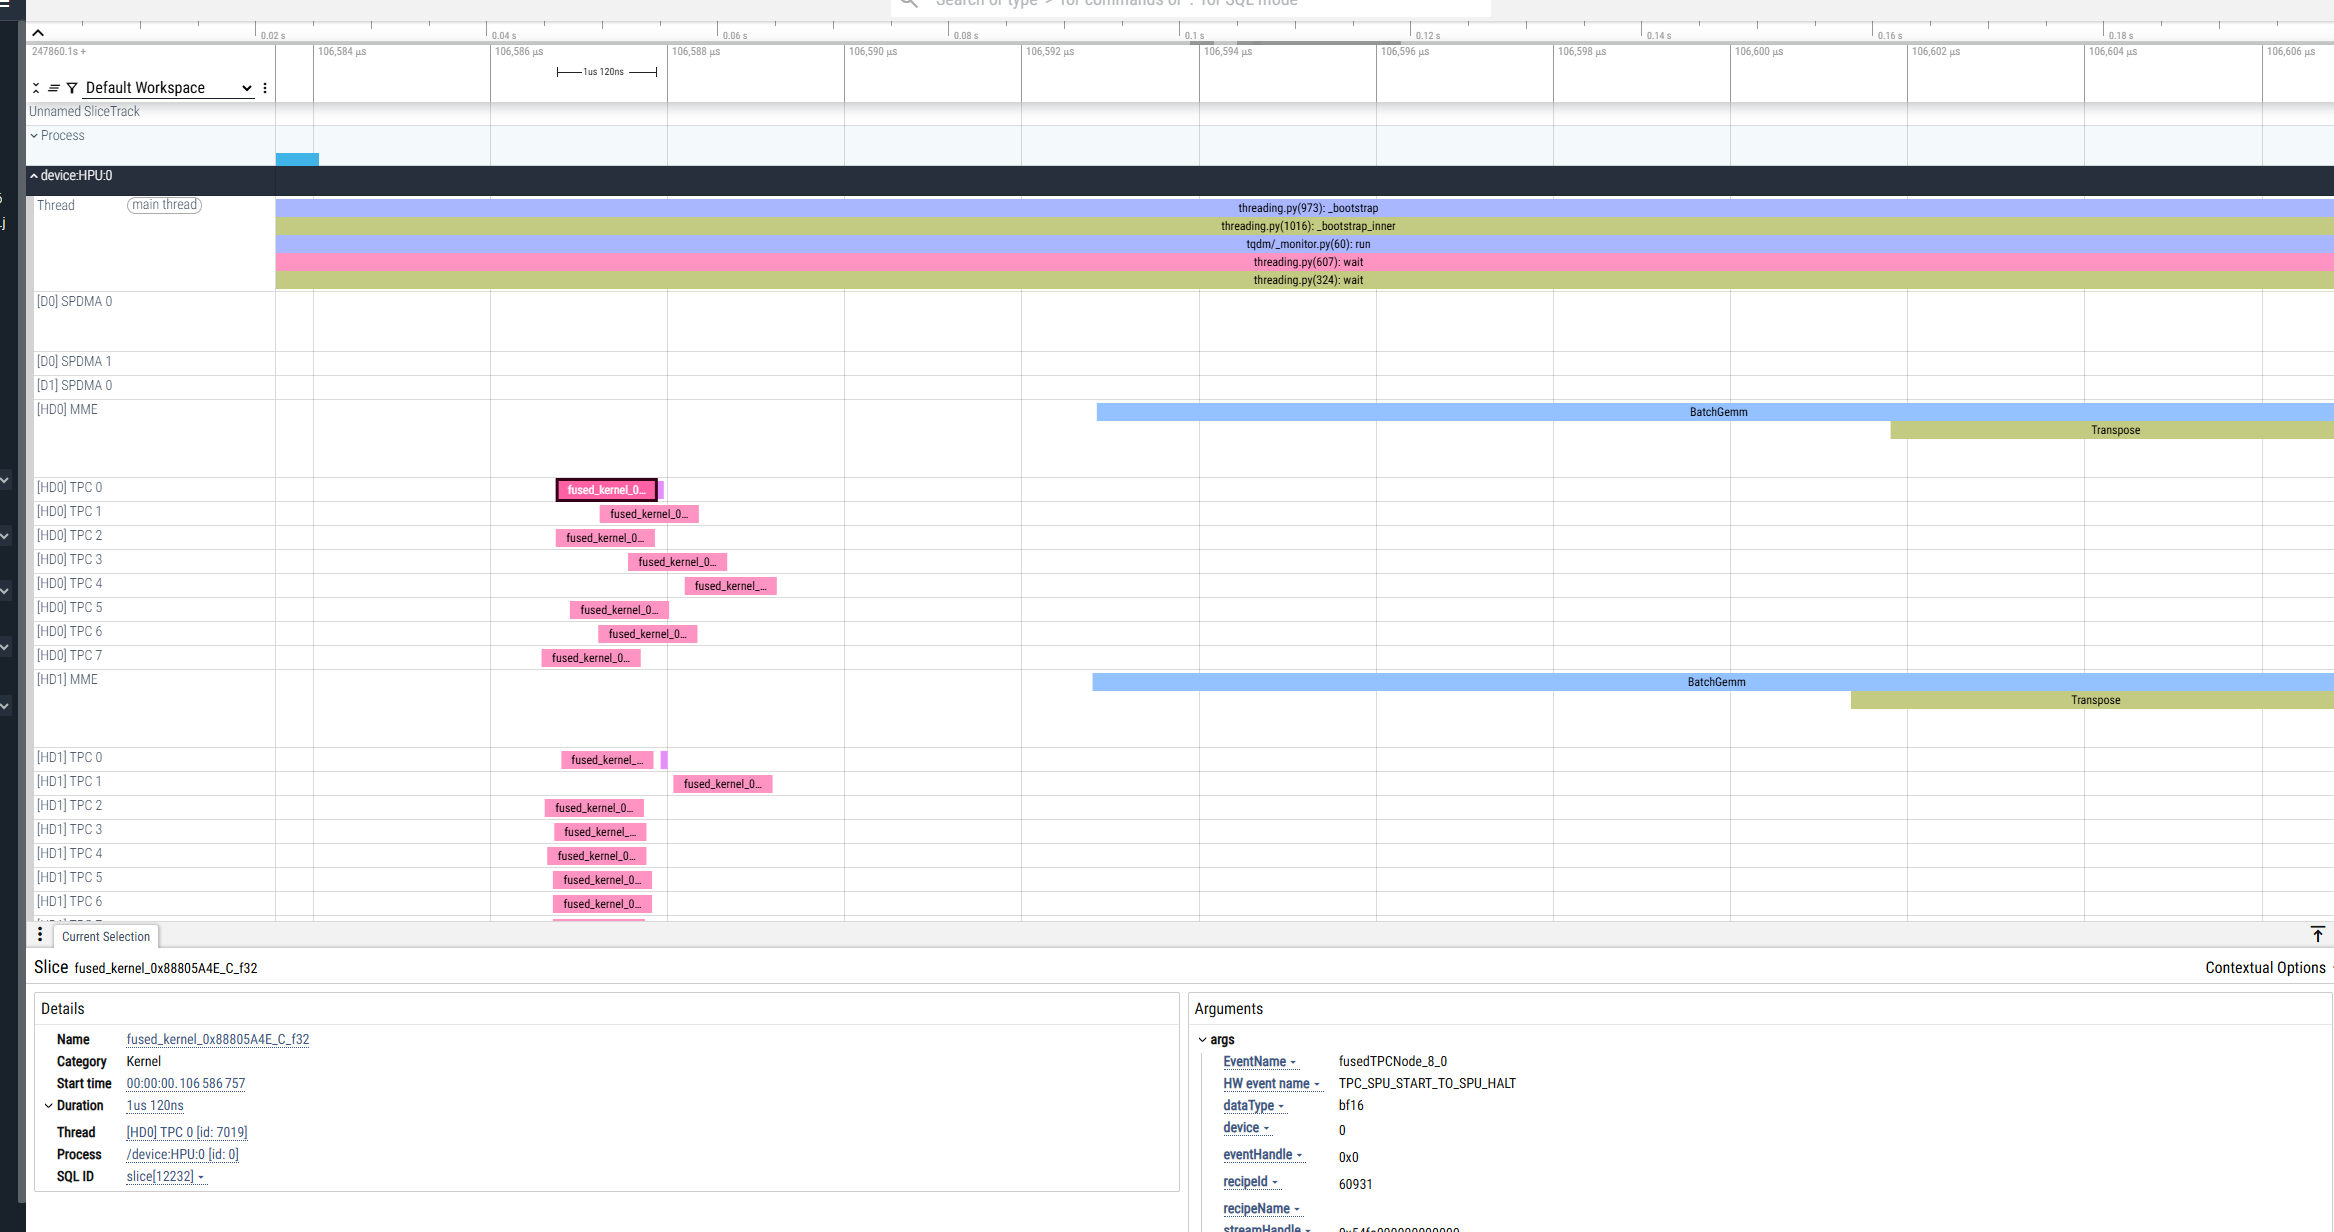
As a result, a *.pt.trace.json.gz file is generated and saved in the current working directory. It can be viewed from Perfetto:
To gain more detailed insights into device-level behavior (e.g., fused graph structures, node names, and trace analyzer data), enhance the profiler configuration:
Configure profiler to collect detailed traces:
hl-prof-config --use-template profile_api_with_nics --fuser on --trace-analyzer on
Set the following flags:
export HABANA_PROFILE_WRITE_HLTV=1
export HABANA_PROFILE=1
Run the profiling with enhanced config. The below example uses decode profiling with detailed traces:
HABANA_PROFILE_WRITE_HLTV=1 HABANA_PROFILE=1 VLLM_PT_PROFILE=decode_256_512_t \
python3 -m vllm.entrypoints.openai.api_server \
  --port 8080 \
  --model "facebook/opt-125m" \
  --tensor-parallel-size 1 \
  --max-num-seqs 256 \
  --dtype bfloat16 \
  --max-model-len 256
As a result, the .hltv file is generated in the current directory in addition to the *.pt.trace.json.gz file:
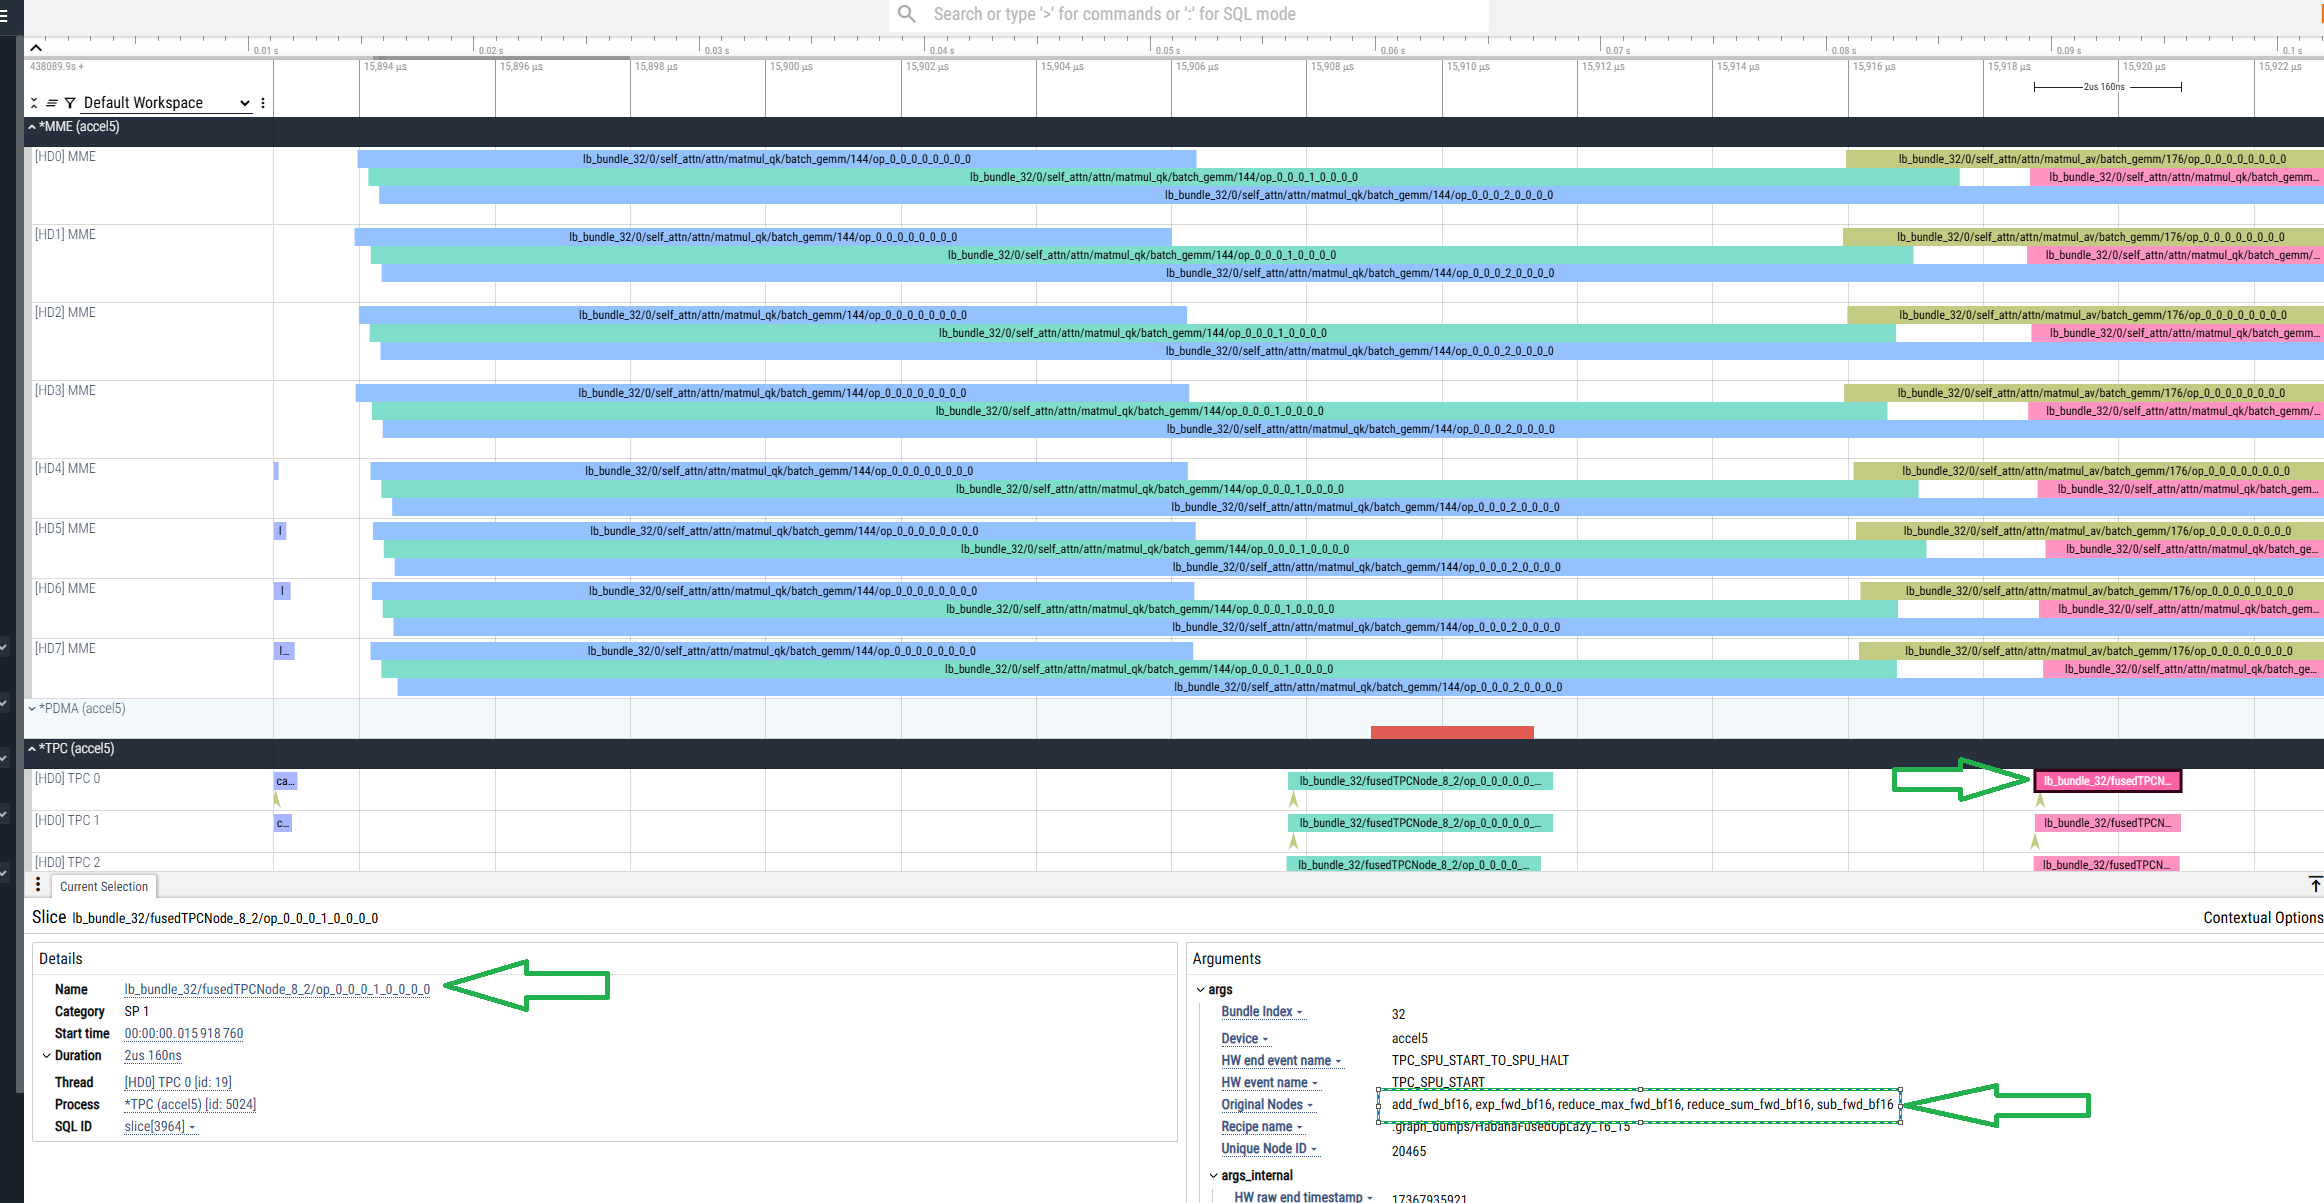
The .hltv contains:
Node names
Graph structures
Information on what’s inside each fused op