Profiling Architecture
Profiling Architecture
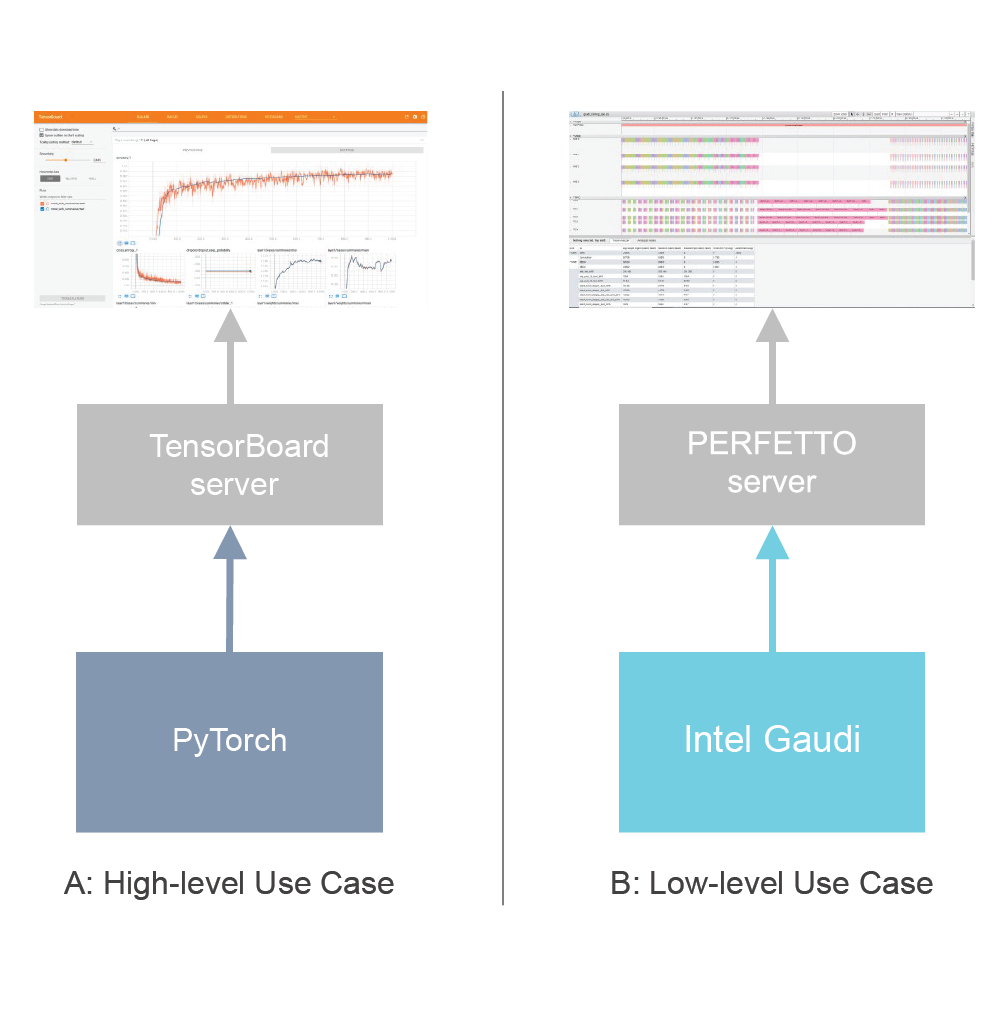
This section describes the control flow for Profiling. The communication diagram below introduces the main components and illustrates the process of data collection, post-processing, and publishing. The diagram itself shall be understood in terms of top-down abstraction (high-level to low-level). The labels indicate the sequence of actions and activities.
Offline, before the training, a configuration file for focused profiling can be created. Typically, the default configuration covers most use cases.
The TensorBoard server can also be started before training. It is a simple web server which formats and visualizes data from the log files generated by PyTorch.
Once training execution is initiated, PyTorch performs standard initial steps such as generating computational graphs for forward and backward propagation. Then, PyTorch starts the training, step by step (batch by batch). Before executing each batch, PyTorch checks whether it is the first batch to be profiled. If it is, it calls an API on Intel Gaudi to start recording Gaudi profile data.
The Intel Gaudi software reads the configuration file for setting up specific profiling instructions to execute on the Gaudi accelerator and retrieves and collects profiling data. It should be noted that a similar process of profiling data collection is executed on the Host/CPU.
The Intel Gaudi software collects profiling data from Gaudi.
PyTorch continuously checks whether to profile the next batch. If it is the last one to profile, PyTorch sends a request to the Intel Gaudi software to stop profiling. The Intel Gaudi software will push the profile data collected during the entire sequence of steps back to PyTorch.
PyTorch collects profiling data from the Host/CPU.
PyTorch runs some analytics on the collected data and prepares formatted logs.
TensorBoard server polls the logs and generates HTML pages for the browser.
The browser displays the profiles data.